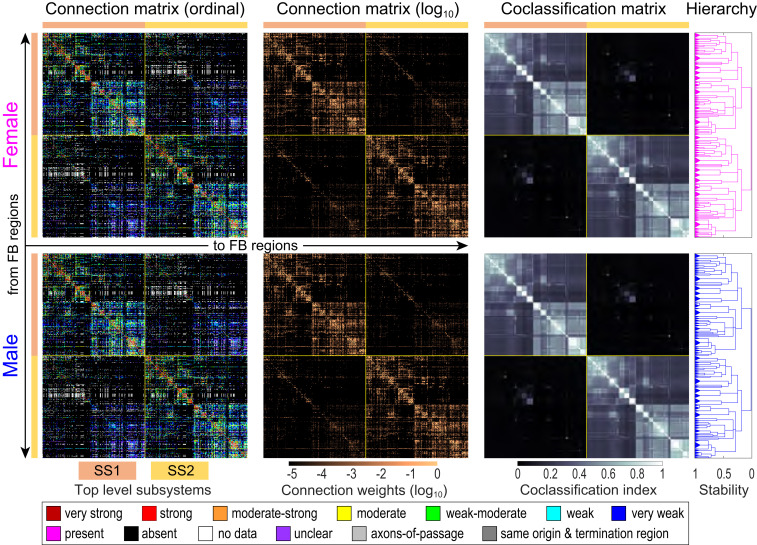
Fig. 2.
Bilateral female and male rat intraforebrain macroconnectomes (FB2). Directed and weighted monosynaptic macroconnection matrices with gray matter region sequence in a subsystem arrangement derived from MRCC analysis. Collated data are represented by descriptive terms corresponding to ordinal weight values (first column; key at bottom) and then converted to binned log-weighted values (second column) for computation. MRCC of the log-weighted connection data generated coclassification matrices (third column), also represented as a hierarchal dendrogram (fourth column) for female (pink) and male (blue). Coclassification refers to how well a given connection correlates with the solutions provided by MRCC analysis. The linearly scaled coclassification index gives a range between 0 (no coclassification at any partitioning resolution) and 1 (perfect coclassification across all partitioning resolutions). Two top-level subsystems (SS1 and SS2; top left and bottom right matrix quadrants, respectively) are outlined in yellow and indicated by colored bars next to the matrices. Except for one region (retina), SS1 and SS2 are unilateral (left side or right side). In an MRCC hierarchy, the length of a particular branch set represents a distance between it and adjacent sets; this length may be interpreted as the branch set’s stability (or persistence) across the entire hierarchy such that dominant solutions (branch sets more resistant to splitting) have longer branches and fleeting or unstable solutions have shorter branches. All solutions plotted in the tree survive the statistical significance level of α = 0.05. Note that specific sexual dimorphisms are not easily discernable here; much greater magnification is required (SI Appendix, Fig. S3 D and E and Dataset S4J). For region (row and column) identity and additional details, see Figs. 5 and 6; SI Appendix, Fig. S3; and Datasets S3 and S4.

