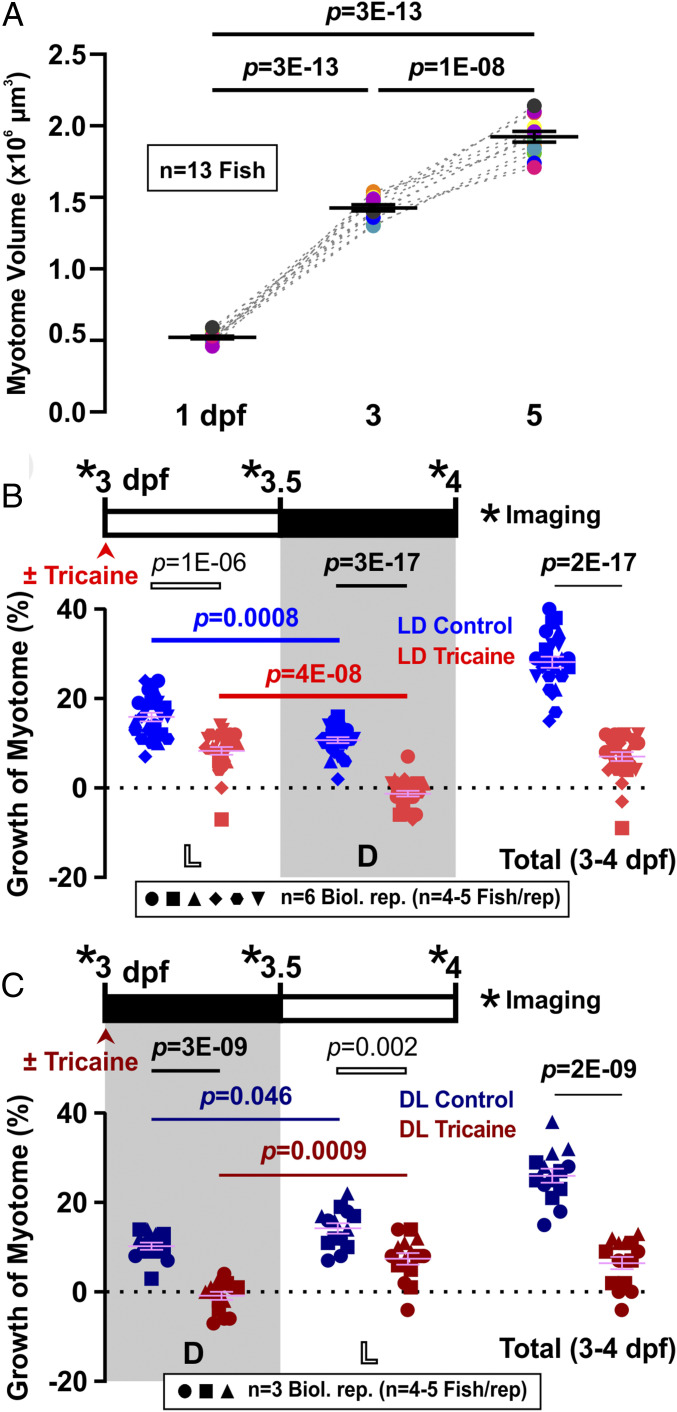
Fig. 1.
Diurnal variation and requirement for activity in volumetric growth of the myotome. (A) Growth of myotome in somite 17 between 1 and 5 dpf. Black bars represent mean ± SEM. Colors represent different individual fish from a single lay (n = 13 fish). (B and C) Larvae raised under LD (B; n = 25 or 26 fish from six biological replicates) or DL (C; n = 14 or 15 fish from three biological replicates) were either untreated (Control, blue/dark blue) or anesthetized (Tricaine, red/dark red) from 3 dpf to 4 dpf. Confocal imaging was performed every 12 h (*) over the 24-h period to measure myotome volume. Graphs show growth of myotome (percent) of individual fish over each 12-h period (left and center) or the full 24 h (right). Complete data on the same LD fish are shown in SI Appendix, Fig. S2 A and B. Symbol shapes distinguish biological replicates from separate lays. L, light; D, dark.

