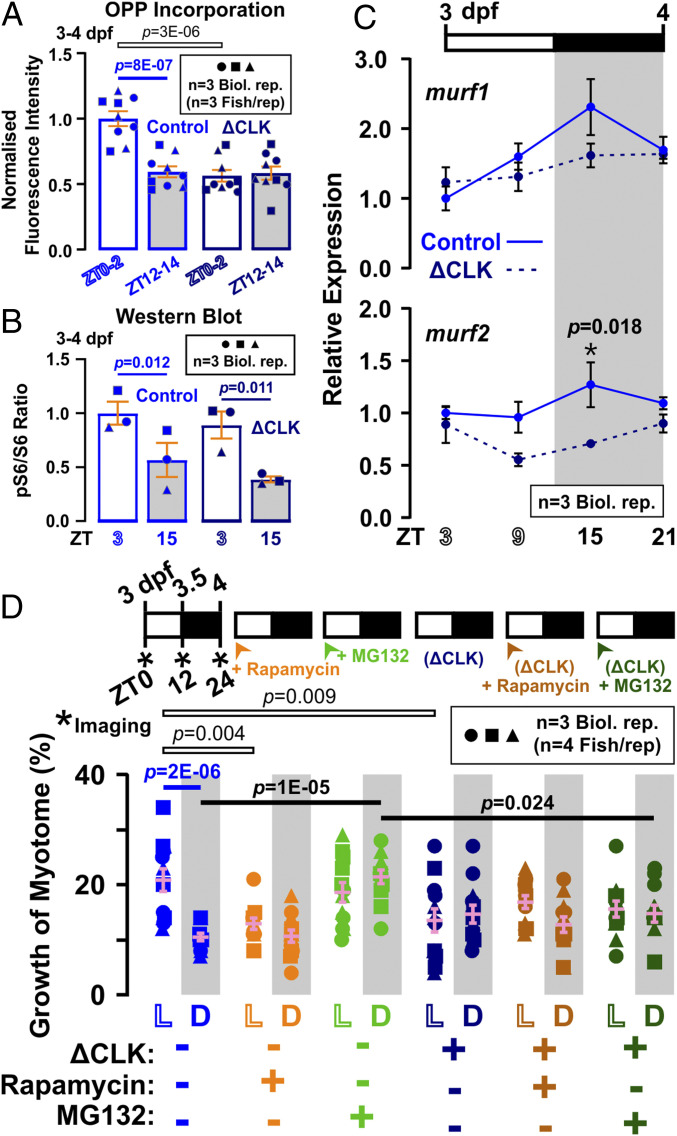
Fig. 7.
Effects of ΔCLK expression on protein metabolism in zebrafish larvae. Control (light blue) and ΔCLK (dark blue) larvae were raised under LD and analyzed between 3 and 4 dpf. (A) Quantification of nascent protein visualized in somite 17 by OPP incorporation at ZT0 to ZT2 and ZT12 to ZT14 (n = 9 fish from three biological replicates; confocal images shown in SI Appendix, Fig. S9C). Signals were normalized to Control ZT0 to ZT2 samples after subtraction of CHX background. (B) Quantification of pS6/S6 ratio at ZT3 and ZT15 (n = 3 biological replicates). Ratios were normalized to control samples at ZT3. Symbols represent distinct lays (biological replicates shown in SI Appendix, Fig. S9D). (C) Diurnal variation in level of atrophy-related genes murf1 and murf2 (n = 3 biological replicates); ef1a was used for normalization. Control strengthens results in Fig. 4A; ΔCLK lacks peak at ZT15. (D) Growth of the myotome (percent) measured between 3 and 4 dpf in α-actin:mCherryCAAX Control (light colors) and ΔCLK (dark colors) larvae that were treated from 3 dpf with either DMSO vehicle (blue), 10 µM rapamycin (orange), or 10 µM MG132 (green). Symbols represent distinct lays (n = 12 fish from three biological replicates). Note that, although the effect of ΔCLK alone to increase nighttime growth did not reach the cutoff for significance in this experimental series (P = 0.36) or that in Fig. 6E (P = 0.47), when both datasets were pooled, ΔCLK caused a significant increase in growth at night (P = 0.022). Similar pooled analysis of the reduction by ΔCLK of daytime growth also increased confidence in the difference (P = 2E-06).

