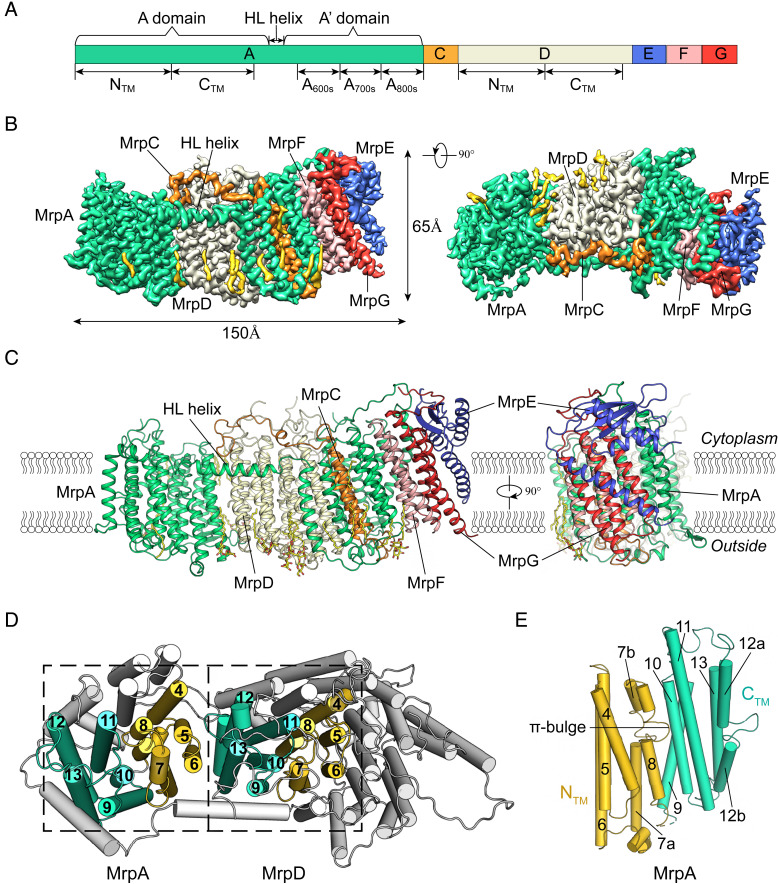
Fig. 1.
Overall structure of the Mrp complex. (A) Schematic diagram of the organization of the Mrp genes. (B) Cryo-EM map of the Mrp complex segmented by subunits (contoured at 6 σ) in front view (Left) and top view (Right). Subunits are colored the same as in A. Densities for lipid molecules are shown in yellow. (C) Two orthogonal views of the Mrp structure in ribbon presentation. Lipid/detergent molecules are included as yellow stick models. (D) The NTM (yellow) and CTM (cyan) domains of subunits A and D emphasized by dashed boxes. (E) Breaks in TM7 and TM12 as well as a π-bulge in TM8 in the Mrp pump subunit. Colored as in D.

