Fig. 4.
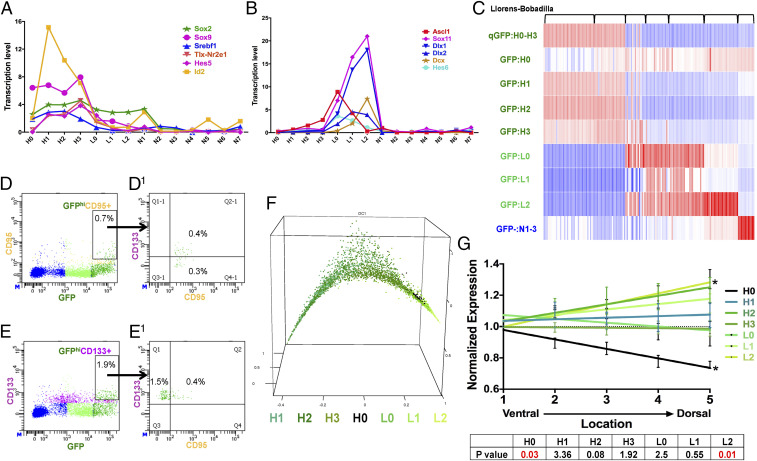
GFPhi cells resolve into four subgroups of quiescent neural stem cells. (A) NSC-specific transcription factors are enriched in the GFPhi subgroups (all SEs < 0.6; units are normalized values scaled to 10,000 counts/cell). (B) Neural progenitor-specific transcription factors are enriched in GFPlo subgroups (all SEs < 0.2; units are normalized values scaled to 10,000 counts/cell). (C) GFPhi and GFPlo subgroup-specific gene signatures improve resolution of published SVZ cell-sequencing profiles. Transcriptomes of 155 cells published in Llorens-Bobadilla et al. (23) were analyzed with our signatures. Each column represents one cell. (D, D1, E, and E1) FACS analysis showed (D and D1) approximately one-half of GFPhi;CD95+ cells are also CD133+, and (E and E1) about 20% of the GFPhi;CD133+ cells are CD95+. (F) Pseudotime analysis provides a nearest neighbor random walk of single-cell transcriptional profiles revealing a linear progression from GFPhi:H1 through GFPlo:L2. (G) H0 cells preferentially reside on the ventral aspect of adult SVZ as defined by Allen Brain Atlas expression profiles. * indicates P values <0.05. See also SI Appendix, Fig. S4.

