Fig. 6.
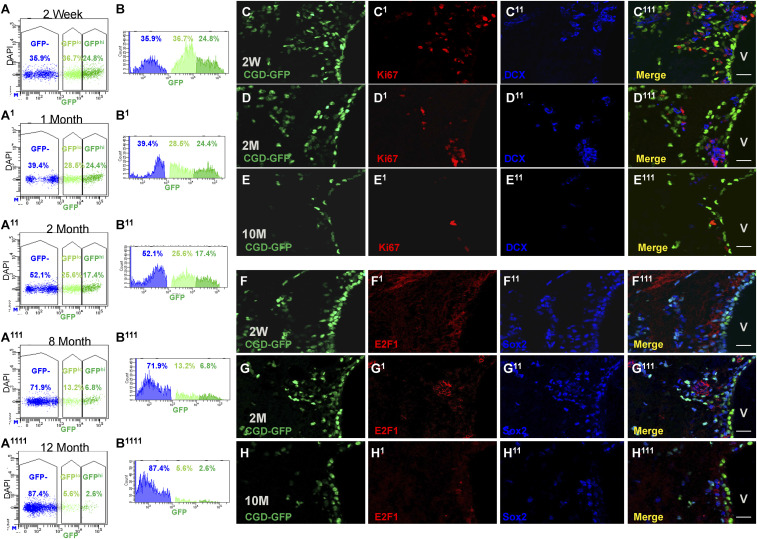
CGD-GFP+ cells decrease over age. (A and B) Whole SVZ FACS analysis delineates the decrease of CGD-GFP+ cells as they age from 2 wk (A and B), 1 mo (A1 and B1), 2 mo (A11 and B11), 8 mo (A111 and B111), until 12 mo (A1111 and B1111). (C–E) IHC staining reveals Commensurate loss of CGD-GFP (C, D, and E) with Mki67 (C1–E1) and DCX (C11–E11) in 2-wk (C–C111), 2-mo (D–D111), and 10-mo mouse brain sagittal sections (E and E111). (Scale bar, 20 μm.) (F–H) IHC staining for CGD-GFP (F–H) and stem/progenitor markers E2F1 (F1–H1) and Sox2 (F11–H11) in 2-wk (F–F111), 2-mo (G–G111), and 10-mo mouse brains (H–H111) (Scale bar, 20 μm.) V: lateral ventricle in C111–H111. See also SI Appendix, Fig. S6.

