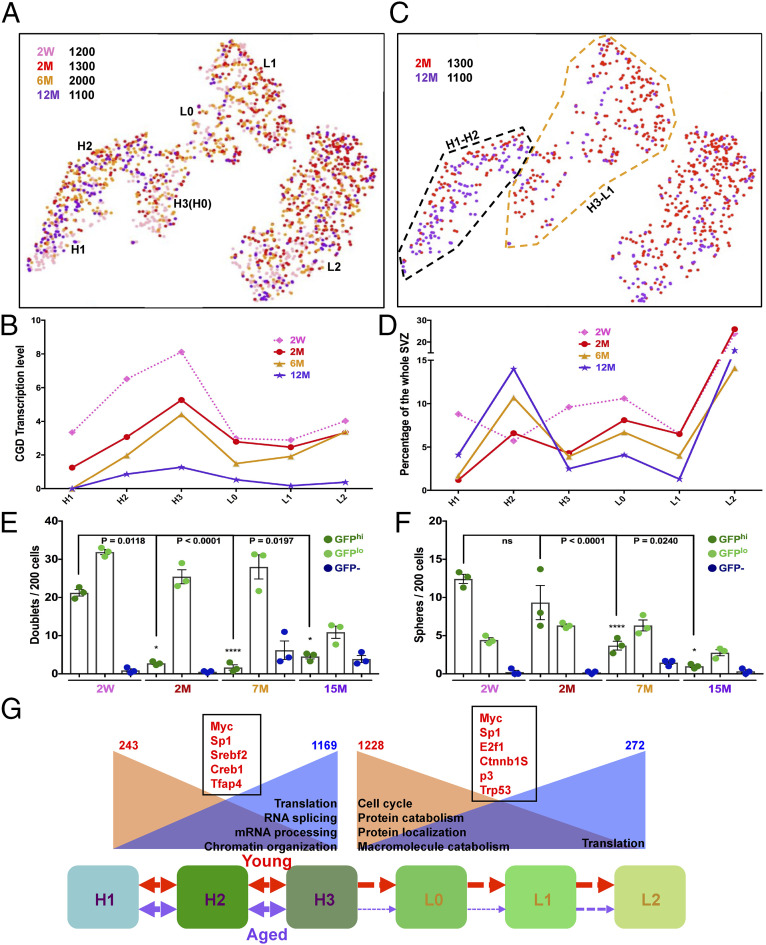
Fig. 7.
Aging quiescent neural stem cells exhibit deficiency in transition to the progenitor state. (A) tSNE projection reveals the neural stem/progenitor lineage distribution of four aged samples: 2 wk and 2, 6, and 12 mo. (B) CGD transcription levels consistently decrease over age in each GFP+ subgroup. (C) Direct comparison of the neural stem/progenitor-cell distribution between 2-mo (red) and 12-mo (purple) samples. Note the stark underrepresentation of the GFP:H3–L1 lineage in the 12-mo sample. The black dashed line marks the H1–H2 lineage, and the brown dashed line characterizes the H3–L1 cluster. (D) Quantitative illustration of distribution of each GFP+ subgroup (H1–L2) at different age points. Note the continuous decrease of H3–L1 lineage from 2- to 12-mo adult SVZs. (E and F) Quantification of doublet and sphere formation assays for SVZ GFPhi, GFPlo, and GFP– cells over age. Note that, by 7 mo, the GFPhi population begins to lose its capacity to transition from doublets to neurospheres, consistent with the reduced capacity to transition from H3 to L1 in vivo. Mean ± SEM; n = 3 biological replicate mice for each group (each representing three technical replicate wells). (G) Cartoon describes the activation blockage of adult NSC in old mice compared to young mice. H1 cells in the SVZ progress into H2 and H3 and then become activated to form L0, L1, and L2 cells. This progress is robust in young mice (red arrows), but reduced significantly in aged mice (purple arrows). H1–H2 and H3–L1 cells from 2 and 12 mo are combined to perform differential gene analysis. The numbers on the top reflect the down-regulated (red) and up-regulated (blue) genes in aged groups. GO analysis from the DEGs unravels potential signaling pathways responsible for the changes. The down-regulated (brown background) or up-regulated (blue background) pathways during aging are summarized. The red genes in black boxes reflect the putative transcription factors associated with the age-related gene expression change in either H1–H2 or H3–L1 lineages. See also Fig. 4F and SI Appendix, Fig. S7 and Dataset S3.

