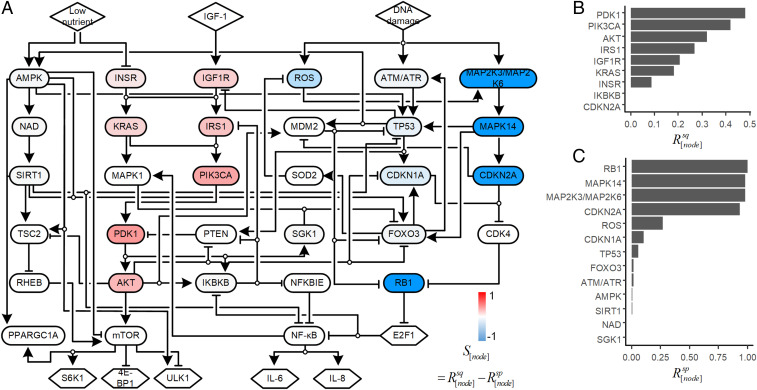
Fig. 2.
Ensemble model simulation to identify senescence-reversing targets. (A) Nodes were colored according to their scores indicating if inhibition resulted in a transition of the network output from senescence attractor to a proliferation attractor (blue, negative values) or from a senescence attractor to a quiescence attractor (red, positive values). The equation for determining the score is shown. (B) A bar graph of the ratio of Boolean network models for which inhibition of the listed node converts the senescence state into the quiescence state (). The values for IKBKB and CDKN2A are close to zero, but not zero. (C) A bar graph of the ratio of Boolean network models for which inhibition of the listed node converts the senescence state into the proliferation state ().

