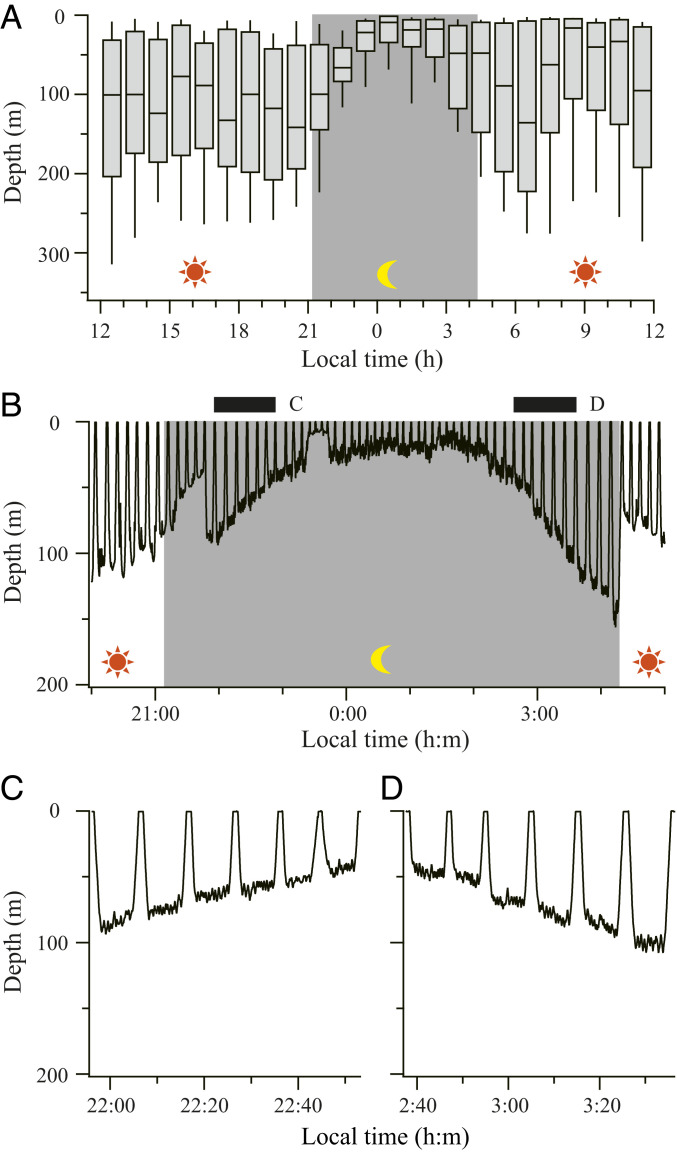
Fig. 2.
Gradual changes in dive depth at night. (A) Dive depth plotted against time of day for all eight Baikal seals. For each hour, the 25th percentile, the median, and the 75th percentile are shown by boxes, and the 9th and 91st percentiles are shown by error bars. Background color represents the day (white) and night (gray) based on the local sunset and sunrise time. (B) An example of time-series depth data. Black bars on top represent the periods shown in detail in C and D. (C and D) Enlarged views of time-series depth data, showing that the seal gradually changed depth not only during a series of dives but also during the bottom phase of each dive.

