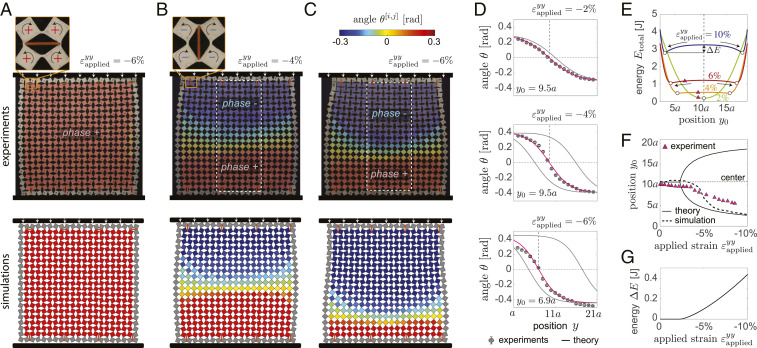
Fig. 2.
(A) Deformation at of a sample with eight phase-inducing defects arranged to induce nucleation of phase+. (B and C) Deformation at (B) and (C) of a sample with eight phase-inducing defects arranged to induce nucleation of phase+ near the bottom boundary and phase- near the top one. Experimental and numerical snapshots are shown at Top and Bottom, respectively. The color corresponds to the rotation of the squares. Zoom-ins of the defects are also shown. (D) Comparison between analytically predicted (solid lines) and experimentally extracted (circles) evolution of the squares’ rotation across the sample for different values of applied strain. (E) Analytically predicted evolution of the total energy of the structure as a function of domain wall position for different values of applied strain. (F) Evolution of the domain wall position as a function of the applied strain as predicted by theory (solid line) and numerical simulations (dashed line) and extracted from experiments (triangles). (G) Evolution of the energy barrier as a function of applied strain .

