
Figure 2.
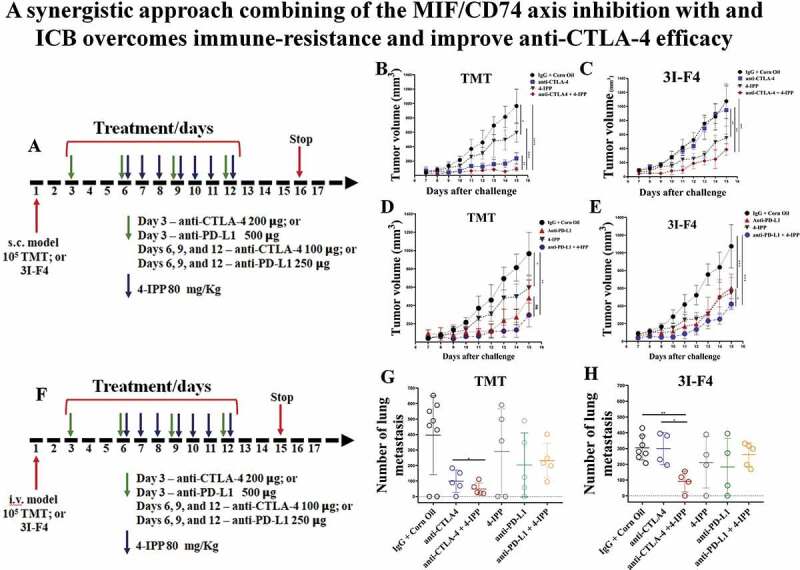
MIF/CD74 axis inhibition enhances immune-checkpoint blockade therapy efficacy. (a) Experimental design using subcutaneous models. Mice were injected on the right flank with 1 × 10⁵ TMT (sensitive anti-CTLA-4 antibody) or 3I-F4 (resistant anti-CTLA-4 antibody) and followed up for 16 days. Green arrows represent anti-CTLA-4 or anti-PD-L1 injections, while blue arrows indicating 4-IPP injections. (b) Treatment with anti-CTLA-4 alone significantly decreased tumor growth in TMT S.C. model (p < .0001). The combination of anti-CTLA-4 with 4-IPP treatment proved to be significantly more effective than treatment with anti-CTLA-4 alone (p < .01); (c) anti-CTLA-4 alone had no effect in the resistant 3I-F4 tumor cells, however, when combined with 4-IPP, a decrease in tumor growth was observed (p < .001); (d, e) Treatment with anti-PD-L1 alone or in combination with 4-IPP significantly inhibited tumor growth in both TMT or 3I-F4 tumor cells. No advantage was observed in the combination treatment; (f) Experimental design using intravenous (i.v.) model. Mice were injected in the tail vein with 106 TMT or 3I-F4 and followed up for 14 days. Green arrows represent anti-CTLA-4 or anti-PD-L1 treatment, while blue arrows represent 4-IPP treatment. (g) Effect of anti-CTLA-4 alone or in combination with 4-IPP on TMT tumor cells significantly reduced the lung nodules number as compared with the vehicle (corn oil) plus IgG2 control. The combination treatment was significantly more effective than treatment with anti-CTLA-4 alone (p < .01). The anti-PD-L1 treatment alone or in combination with 4-IPP showed no effect in TMT I.V. model. (h) Treatment with anti-CTLA-4 alone had no effect on 3I-F4 lung colonies number, however, when combined with 4-IPP, a significant decrease in the lung colonies number was observed (p < .01). The anti-PD-L1 alone or combined with 4-IPP had no effect in 3I-F4 I.V. model. Data are cumulative of one experiment with five mice per group. Error bars represent the mean ± SEM. *P < .05, **P < .01, and ****P < .0001 using t-Test statistical analysis