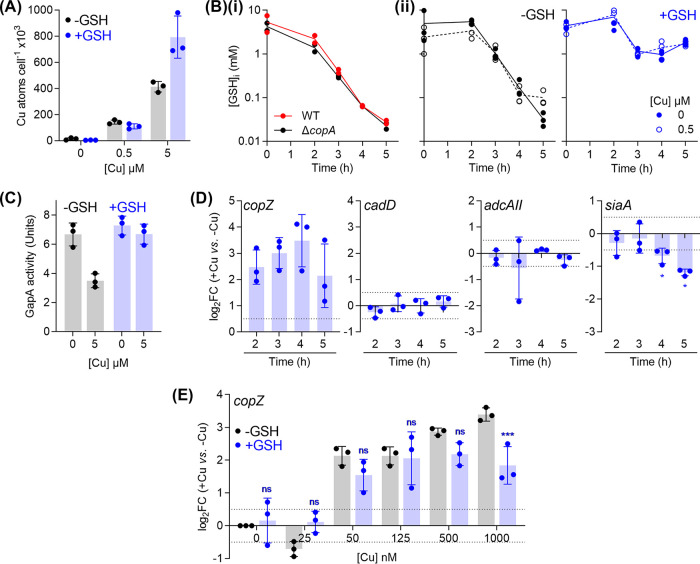
FIG 6.
Buffering of excess intracellular Cu ions by GSH. GAS ΔcopA mutant strain was cultured with added Cu as indicated, without (black) or with (blue) 0.1 mM added GSH. The following properties were subsequently measured. (A) Intracellular Cu levels. Cultures (n = 3) were harvested at t = 4 h, and total cellular levels of Cu were measured by ICP-MS. GSH supplementation did not affect intracellular Cu levels when cultures were treated with 0 (P = 1) or 0.5 μM Cu (P = 0.92), but it did lead to an increase in Cu levels when cultures were treated with 5 μM Cu (P < 0.0001). (B) Intracellular GSH concentrations. (i) Cultures (n = 2) were prepared without any added Cu or GSH and sampled at the indicated time points. Intracellular levels of GSH were measured in cell extracts. There was no clear difference between the time-dependent decrease in intracellular GSH levels of WT and ΔcopA cultures. (ii) Cultures (n = 3) were sampled at the indicated time points and intracellular levels of GSH were measured in cell extracts. Cu treatment did not affect intracellular GSH levels, regardless of GSH supplementation (P = 0.95 for 0 mM GSH, P = 1.0 for 0.1 mM GSH). GSH supplementation improved intracellular GSH levels (P < 0.0001 for both 0 and 0.5 μM Cu), regardless of Cu treatment. (C) GapA activity. Cultures (n = 3) were harvested at t = 4 h. GapA activity was measured in cell extracts. Cu treatment suppressed GapA activity in GSH-depleted cultures (P = 0.0007) but not in GSH-supplemented cultures (P = 0.51). (D) Expression of metal homeostasis genes. GSH-supplemented cultures (n = 3) were sampled at the indicated time points. Levels of copZ, cadD, adcAII, and siaA transcripts in Cu-treated cultures were determined by qPCR and normalized to the corresponding untreated samples that were harvested at the same time points. Horizontal dotted lines represent the limit of the assay (log2FC = ±0.5). Cu treatment induced copZ expression (P = 0.023, 0.013, 0.026, and 0.093), but not cadD (P = 0.17, 0.71, 0.98, and 0.32), or adcAII (P = 0.39, 0.50, 0.03, and 0.16) at t = 2, 3, 4, and 5 h, respectively (versus log2FC = 0). Cu treatment continued to downregulate siaA expression (P = 0.63, 0.03, 0.04, and 0.03 for t = 2, 3, 4, and 5 h, respectively, versus log2FC = 0). (E) Cu-dependent expression of copZ. Cultures (n = 3) were sampled at t = 4 h. Levels of copZ transcripts in Cu-treated cultures were normalized to the corresponding untreated samples. Horizontal dotted lines represent the limit of the assay (log2FC = ±0.5). GSH supplementation did not affect copZ expression at low concentrations of added Cu (ns, P = 0.10, 0.14, 0.48, 1.0, and 0.31 for [Cu] = 0, 25, 50, 125, and 500 nM), but it did affect expression at 1000 nM added Cu (***, P = 0.0009).

