FIG 4.
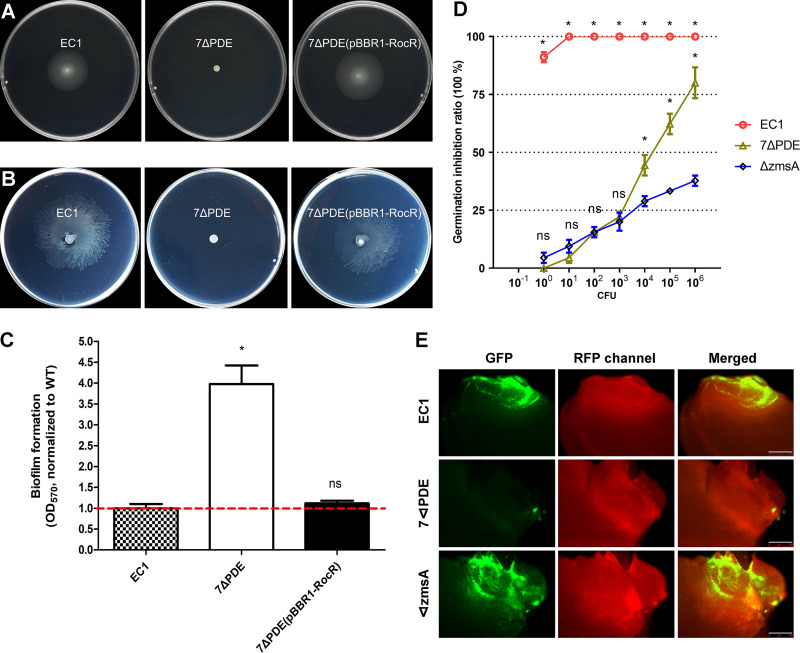
Phenotype assay of mutant 7ΔPDE. (A) Swimming motility. (B) Swarming motility. (C) Biofilm formation in SOBS medium. *, P < 0.001 (by Student’s t test) (n ≥ 3 independent experiments). (D) Virulence assay on rice seed germination. Asterisks above the points for wild-type EC1 represent statistical analyses of both EC1 versus 7ΔPDE and EC1 versus the ΔzmsA strain, while asterisks above the points for the 7ΔPDE strain represent statistical analysis between 7ΔPDE and the ΔzmsA strain. *, P < 0.0001; ns, P > 0.01 (by two-way ANOVA with multiple comparisons) (n ≥ 3 independent experiments). (E) Fluorescence inverted microscopy observation of colonization. Bars = 500 μm.

