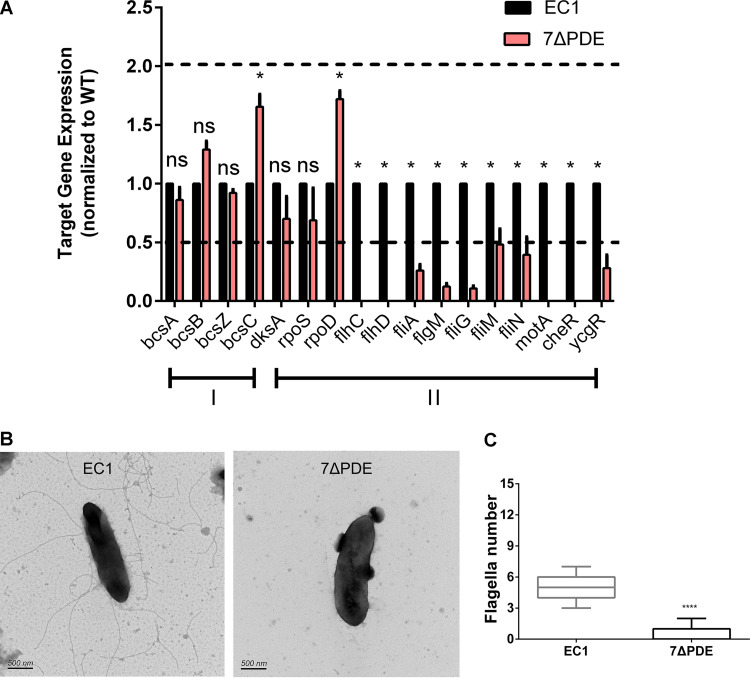
FIG 5.
Quantitative RT-PCR and transmission electron microscopy analyses of wild-type EC1 and mutant 7ΔPDE. (A) Expression levels of the genes related to biofilm (I) and flagellar transcription (II) hierarchies by qRT-PCR. The dotted lines represent 2-fold and 50% gene expression levels compared to the wild-type, which was set to a value of 1. *, P < 0.01; ns, P > 0.01 (by two-way ANOVA with Bonferroni’s multiple-comparison test). (n ≥ 3 independent experiments). (B) Representative transmission electron microscopy graphs of wild-type EC1 and mutant 7ΔPDE cells after negative staining. (C) Numbers of flagella of EC1 and 7ΔPDE. ****, P < 0.0001 (by Student’s unpaired t test).

