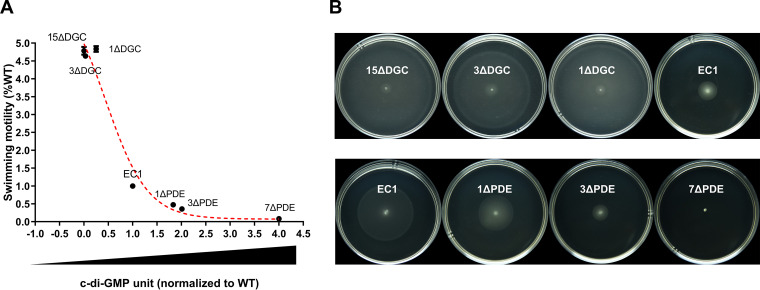
FIG 7.
Swimming motility shows an L-shaped regression curve with c-di-GMP concentrations. (A) Swimming motility and c-di-GMP concentrations of 7 representative strains and mutants, as indicated, were chosen to fit the curve. (B) Swimming motility of the corresponding strains and mutants described above for panel A. Images were taken at 12 h (top row) and 24 h (bottom row). The experiment was repeated at least three times.

