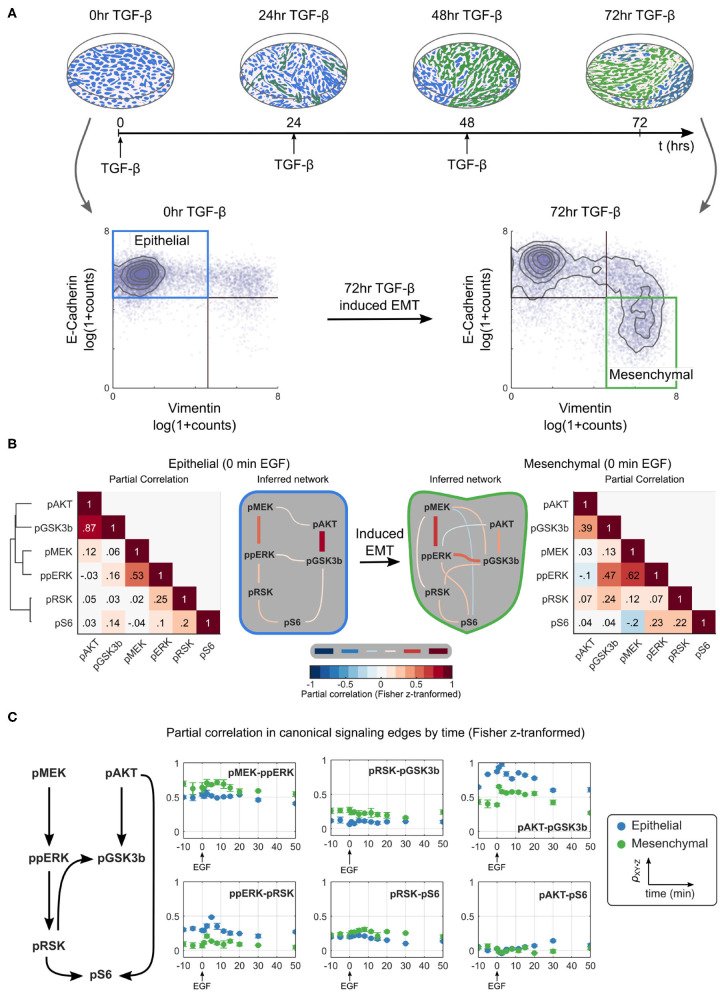
Figure 2.
Partial correlation-based network inference suggests that the ERK/AKT signaling network is significantly rewired during EMT. (A) Overview of an EMT model (top) including an illustration of the visual phenotype and a molecular definition of epithelial and mesenchymal cells measured by mass cytometry at various time points (bottom). (B) Partial correlation (ρXY·Z) analysis of phosphoproteins is used to infer the different network structures in epithelial and mesenchymal cells sampled across replicates. The threshold for accepting an edge between X and Y is defined as ρXY·Z ≥ |0.1|. All values are Fisher z-transformed. (C) Time dependence of signaling strength in canonical signaling edges. Blue and green represent epithelial and mesenchymal phenotypes, respectively. Error bars represent standard deviation of partial correlation across replicates.

