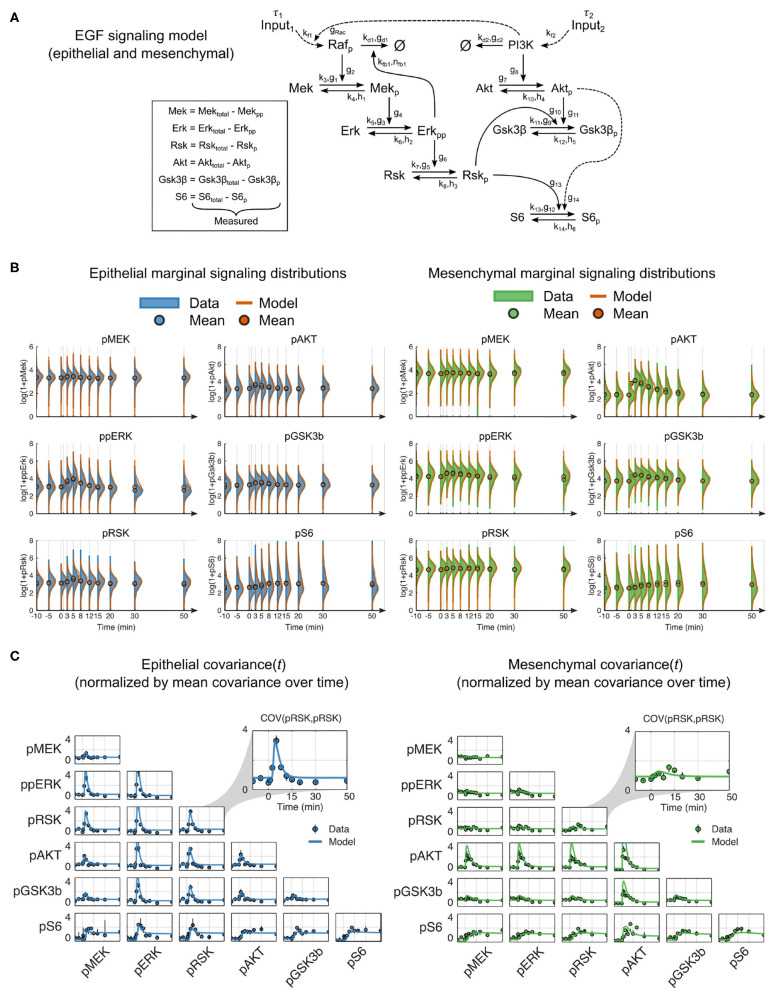
Figure 3.
Mechanistic model of EGF signaling in ERK and AKT pathways with parameter fits to epithelial and mesenchymal cells. (A) Model reaction structure and measured variables used for each phenotype annotated with kinetic parameters. (B) Marginal distributions of (log2 transformed) data (solid) and model simulations (orange line) for dynamic signaling variables in epithelial (blue solid, left) and mesenchymal (green solid, right) cells. Circles represent means. To enhance visualization, the mean, rather than the marginal distribution, at the 1-min time point is not shown. (C) Data (symbols) and model simulations (line) of covariance between signaling variables over time in cells of both phenotypes. Black bars represent the range of covariances across replicates. All values in (B,C) were calculated by random subsampling of cells across experimental replicates.

