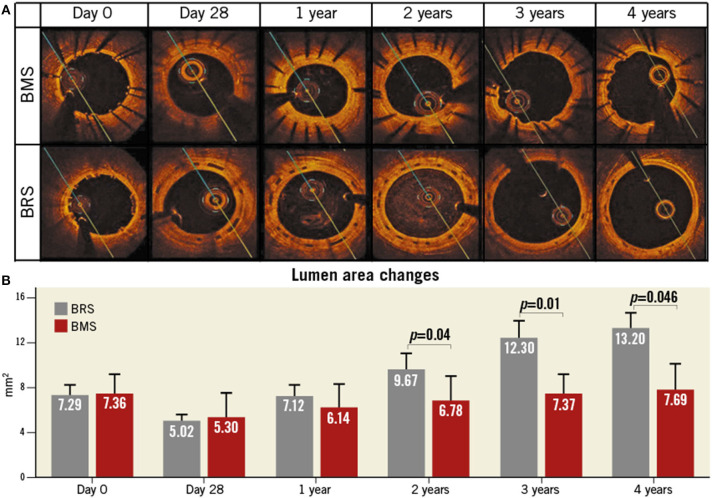
Figure 1.
Lumen area changes of BMS and BRS by using OCT to process the longitudinal assessment. (A) Typical images to compare the lumen area changes between BMS (top panel) and BRS (bottom panel). (B) Quantitative analysis of the relevant in-stent lumen area regarding BMS (red) and BRS (gray) for 4 years. BRS, bioresorbable scaffolds; BMS, bare metal stents; OCT, optical coherence tomography. This Figure is reprinted from ReF.28, Vahl et al. (28), Copyright 2016, with permission from Copyright Clearance Center.

