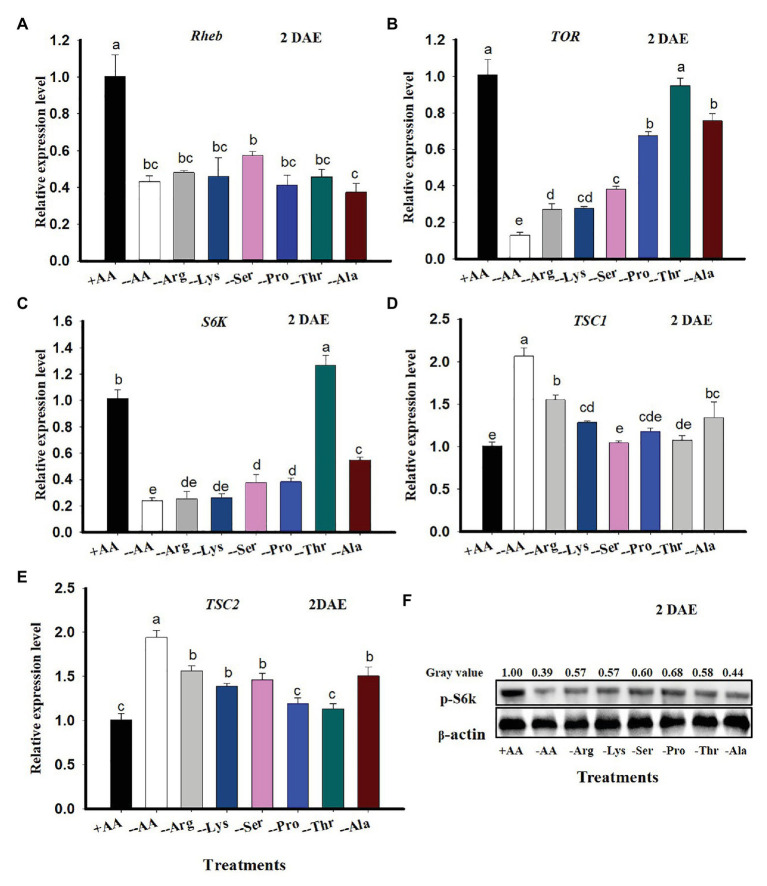
Figure 2.
TOR gene expression in C. lividipennis in response to amino acid (AA) signals. Columns represent gene expression in C. lividipennis supplied with an artificial diet containing the following AAs:+AAs (+Ala, +Arg, +Lys, +Ser, +Pro, and +Thr), without −AAs (−6 AAs: −Ala, −Arg, −Lys, −Ser, −Pro, and −Thr), or lacking individual AAs (−1 AA: −Ala, −Arg, −Lys, −Ser, −Pro, or −Thr). Panels (A–E) show mean expression levels of Rheb, TOR, S6K, TSC1, and TSC2 as measured by qPCR at DAE; β-actin was used as a reference gene. Panel (F) shows the phosphorylation status of S6K in adult females (n = 15) by western blot analysis. Antiserum to β-actin was used as a loading control. Each treatment and control represent three independent biological replicates, and error bars show means ± SEM. Columns labeled with different letters indicate a significant difference at p < 0.05 by the Student’s t-test.

