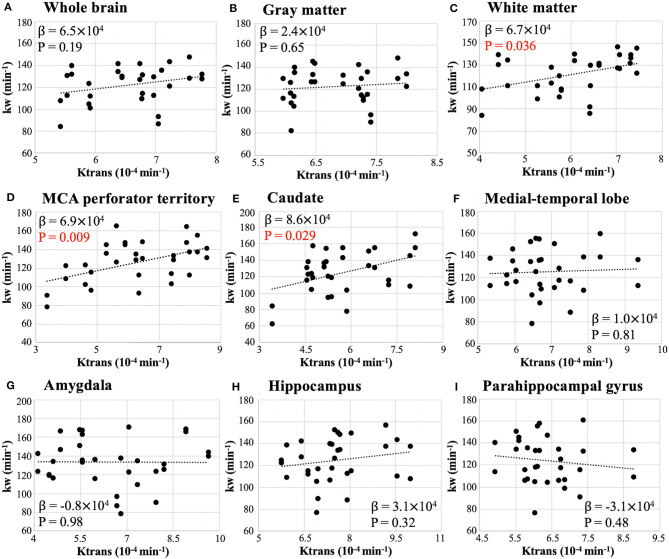
Figure 4.
Scatter plot of whole-brain (A) and regional (B–I) Ktrans vs. kw from test and retest scans. β is the regression coefficient of the mixed-effect linear regression. Significant correlation was found in white matter (β = 6.7 × 10⁴, P = 0.036), caudate (β = 8.6 × 10⁴, P = 0.029), and MCA perforator territory (β = 6.9 × 10⁴, P = 0.009).

