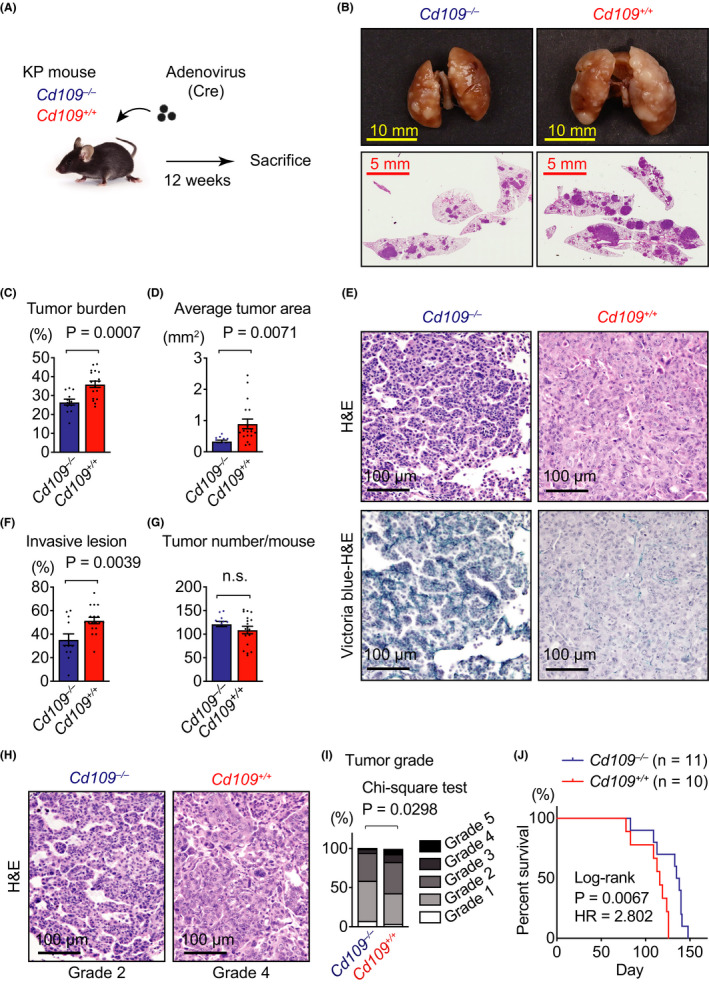
FIGURE 2.

CD109 deficiency reduces tumor invasion in KrasLSL‐G12D/+;p53flox/flox (KP) mouse model. A, Schematic diagram of the carcinogenesis protocol in KP mice. B, Representative images of lungs (upper panels) and H&E‐stained whole lung sections (lower panels) from Cd109−/− and Cd109+/+ KP mice. C, Comparison of average tumor burden between Cd109−/− and Cd109+/+ KP mice. D, Average tumor area in Cd109−/− and Cd109+/+ KP mice. E, Representative histological images of elastic fibers in mouse lung adenocarcinomas at 12 wk after tumor initiation by adenovirus administration. H&E (upper panels) and Victoria blue‐H&E (lower panels) stainings in the same area in the serial section. Left, noninvasive tumors with preserved elastic fibers in a Cd109−/− KP mouse. Right, invasive tumors with disrupted elastic fibers in a Cd109+/+ KP mouse. F, The ratio of invasive lesion determined by Victoria blue staining to tumor area was expressed in percentage (n = 12 for Cd109−/− and n = 18 for Cd109+/+ tumors). G, Tumor numbers in Cd109−/− (n = 12) and Cd109+/+ (n = 18) KP mice. H, Representative histological images of Cd109−/− and Cd109+/+ tumors for analysis of histological grade. I, Histological grade of the tumors in Cd109−/− and Cd109+/+ KP mice using a previously described grading system. 6 For instance, histological grades of Cd109−/− and Cd109+/+ tumors in (H) were determined as Grade 2 and 4, respectively. J, Survival rates of Cd109−/− (n = 11) and Cd109+/+ (n = 10) KP mice were analyzed by the Kaplan‐Meier method. Error bars indicate standard error of the mean. LW, lung weight; BW, body weight; HR, hazard ratio; n.s., not significant
