FIGURE 5.

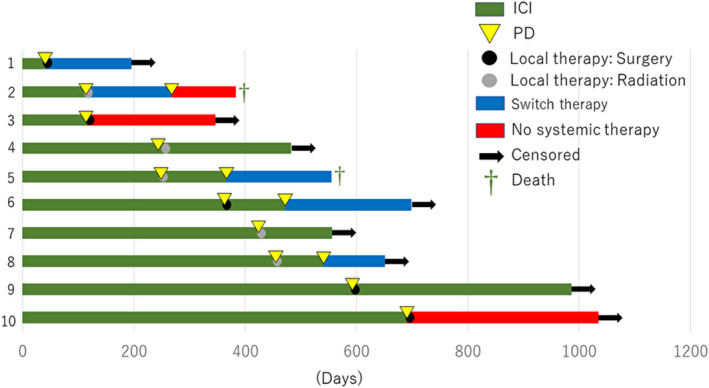
Development and management of acquired resistance to ICIs. Swimmer plot showing the time to resistance after the initial response to ICIs and local therapy among 10 patients. Each bar represents 1 patient

Development and management of acquired resistance to ICIs. Swimmer plot showing the time to resistance after the initial response to ICIs and local therapy among 10 patients. Each bar represents 1 patient