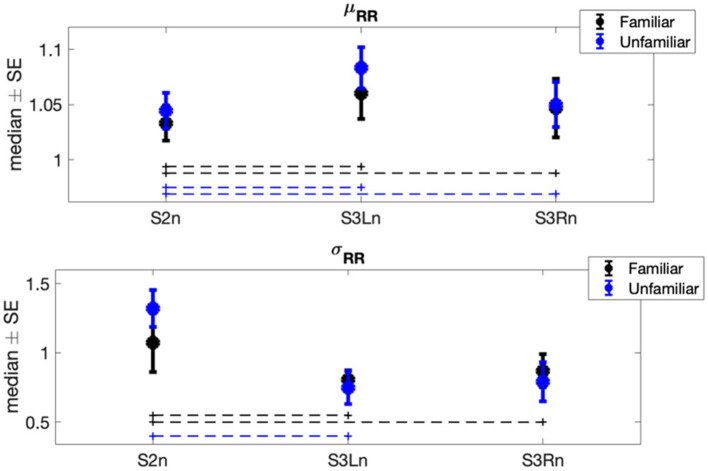
Figure 2.
Each error bar represents the median ± standard error (SE) of time-domain normalized features showing at least a significant result in one of the two statistical analyses (i.e., Φ1 or Φ2) in each experimental session. Blue plots are associated with the heart rate variability (HRV) signals recorded during the interaction between horses and the related familiar person; black plots are associated with the HRV signals recorded during the interaction between horses and the related non-familiar person. The dot lines indicate which pair of sessions was significantly different within each group.

