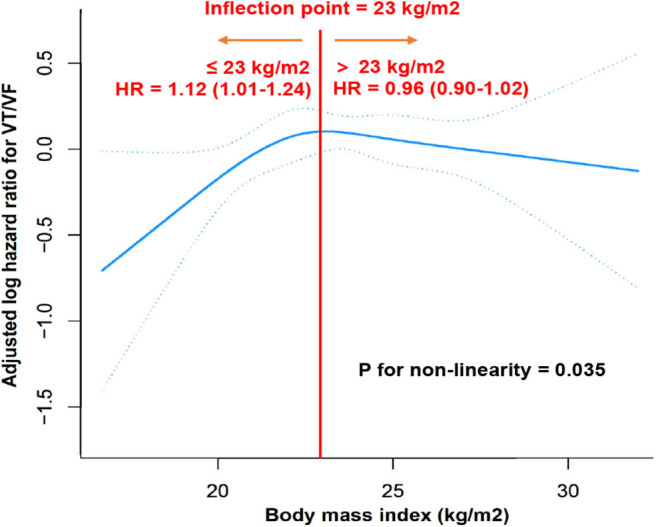
Figure 3.

Dose response relationship of BMI and VT/VF. A non-linear association between BMI and VT/VF was found (P for non-linearity = 0.035) in a generalized additive model. The solid blue line and dashed blue line represent the estimated values and their corresponding 95% CI. Adjustment factors included all covariates presented in Table 1. The inflection point detected for BMI was 23 kg/m2. When BMI was ≤23 kg/m2, HR per unit (kg/m2) higher BMI was 1.12 (95% CI 1.01–1.24). However, When BMI was > 23 kg/m2, higher BMI did not add risk of VT/VF but showed a trend of decreased risk of VT/VF (HR 0.96, 95% CI 0.90–1.02). BMI, body mass index; CI, confidence interval; HR, hazard ratio; VT/VF, ventricular tachycardia/ventricular fibrillation.
