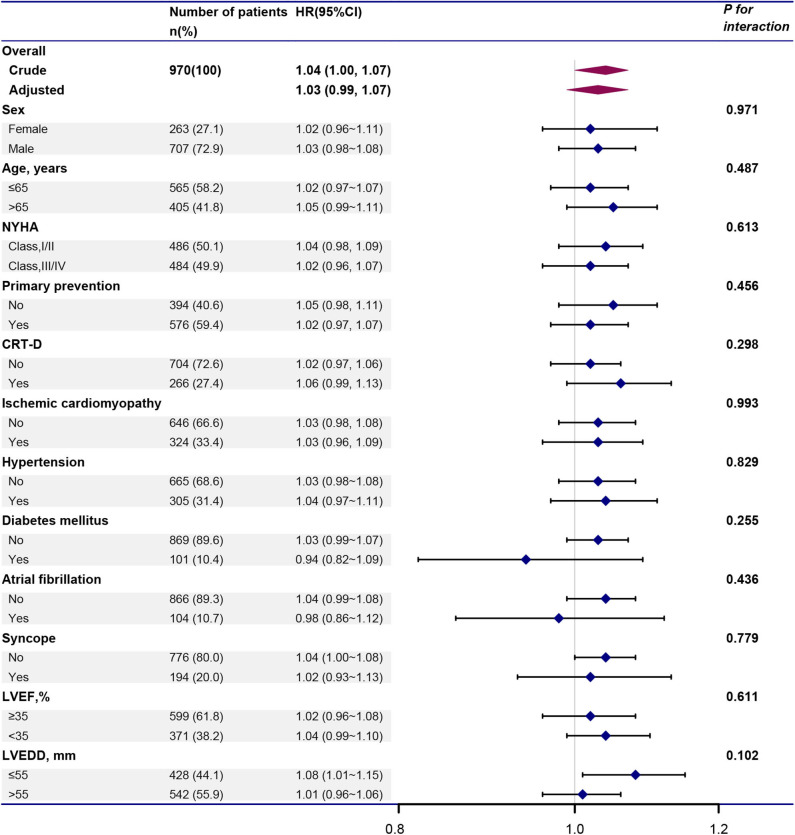
Figure 4.
Forest plot illustrating the HR and 95% CI of BMI and VT/VF in total population and various subgroups. Above models adjusted for all covariates presented Table 1. In each subgroup, the model is not adjusted for the stratification variable. CI, confidence interval; HR, hazard ratio; VT/VF, ventricular tachycardia/ventricular fibrillation. Other abbreviations are shown in Table 1.

