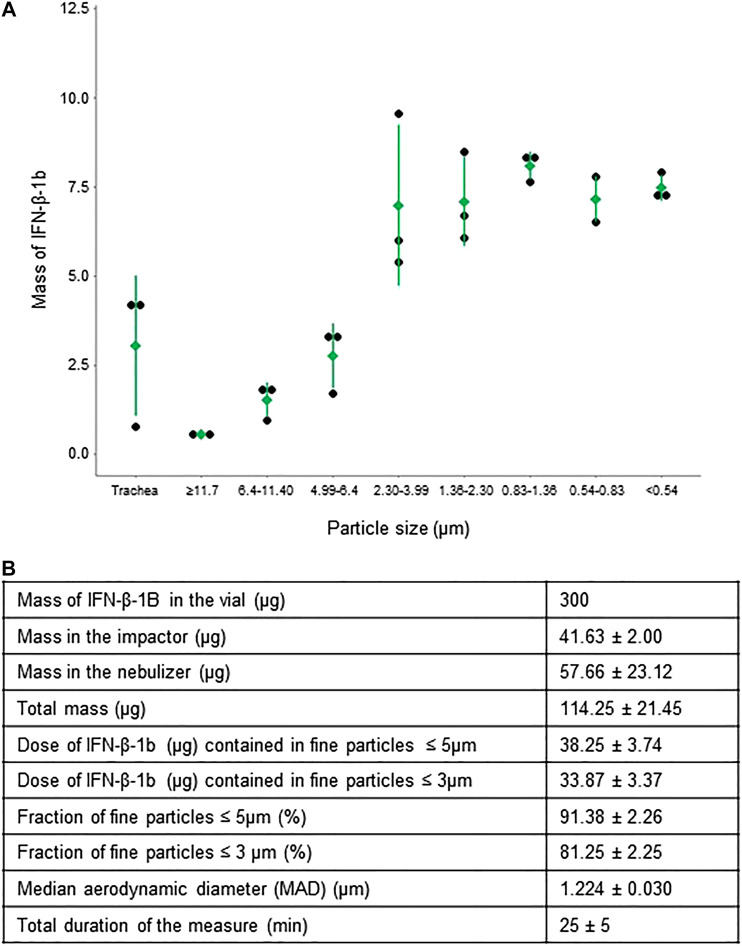
FIGURE 4.
Distribution of IFN-β-1b in fine particles. (A) Mass of IFN-β-1b in particles of different aerodynamic sizes. Means ± standard deviation are shown in green. Each black dot represents one experiment (n = 3). (B) Mass of IFN-β-1b in fine particles and in residue. Data are expressed as mean ± standard deviation (n = 3). Total duration of the measurements: 25 ± 5 min.

