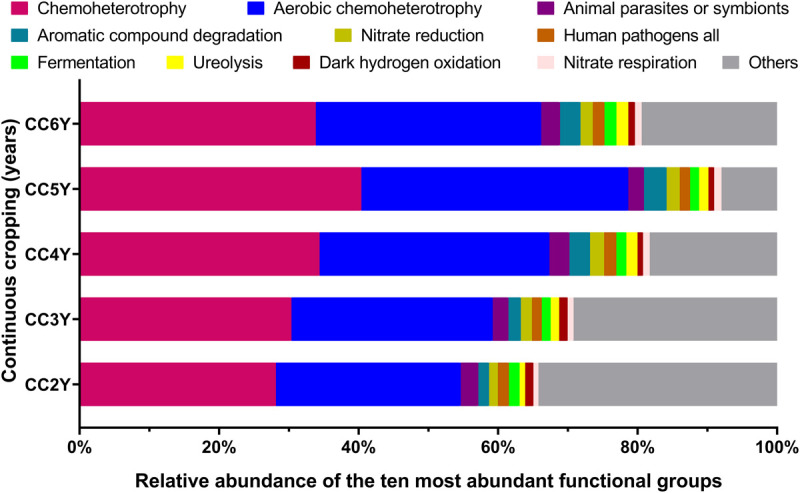
FIGURE 3.

Distribution of bacterial ecological function in the FaProTax database for different continuous cropping durations. CC2Y, CC3Y, CC4Y, CC5Y, and CC6Y represent continuous cropping for 2, 3, 4, 5, and 6 years, respectively. Values represent means (n = 4). The 10 most abundant bacterial functional groups are shown.
