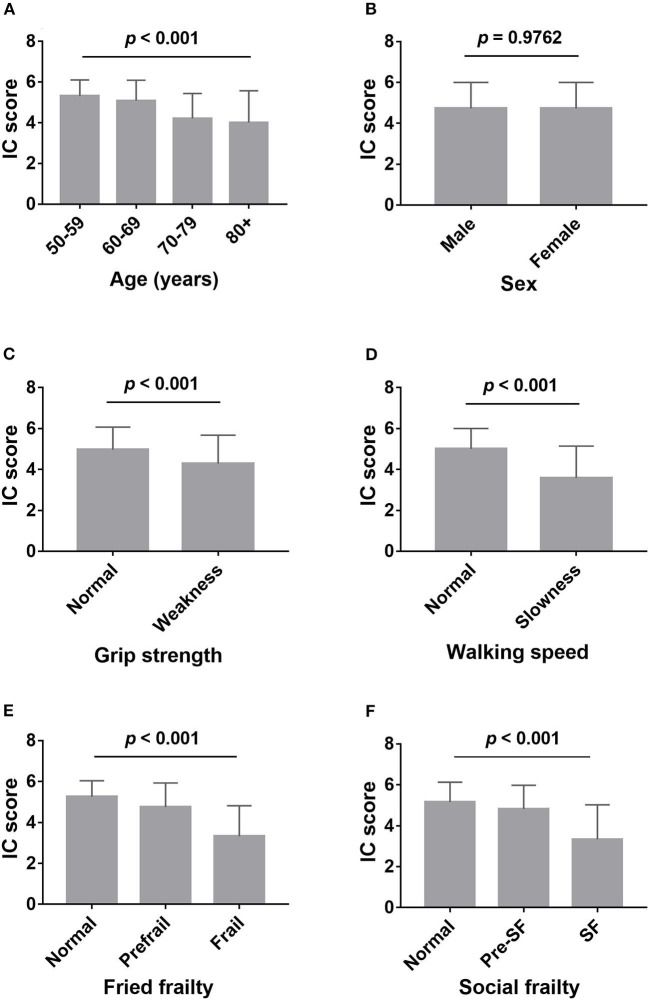
Figure 1.
Comparison of intrinsic capacity score between different groups. (A) Comparison of intrinsic capacity score among the different age groups; (B) comparison of intrinsic capacity score between male and female; (C) comparison of intrinsic capacity score between weakness (low grips strength) and normal grip strength; (D) comparison of intrinsic capacity score between slowness (slow walking speed) and normal walking speed; (E) comparison of intrinsic capacity score among robust, prefrailty, and frailty, assessed by Fried phenotype; (F) comparison of intrinsic capacity score among normal, presocial frailty, and social frailty, assessed by HALFT scale. IC, intrinsic capacity; SF, social frailty.

