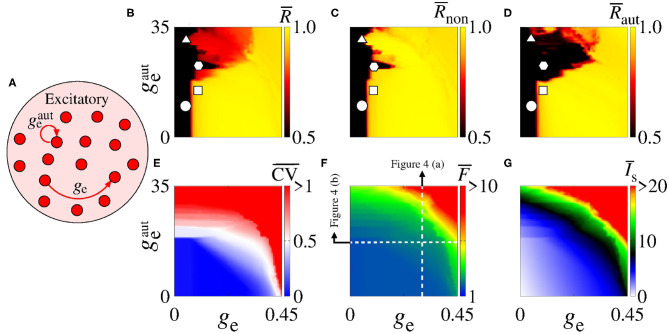
Figure 2.
(A) Schematic representation of the neural network where ge is the intensity of excitatory synaptic conductance and of the excitatory autaptic conductance. Parameter space , where the color bars correspond to (B) , (C) , (D) , (E) , (F) , and (G) . The raster plots of the parameters indicated in (B–D) (circle, square, triangle, and hexagon) are shown in Figure 3. The vertical and horizontal white, dash, lines in (F) are used to vary and ge in the computations in Figures 4A,B, respectively. The closed loop in (A) corresponds to an autapse of excitatory autaptic conductance .

