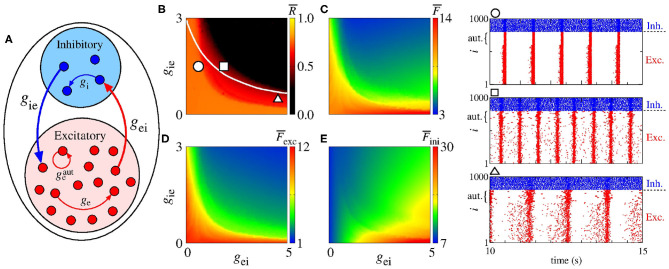
Figure 8.
(A) Schematic representation of a neural network with a mix of excitatory and inhibitory neurons with excitatory autapses. Parameter spaces gei × gie for ge = 0.5 nS, gi = 2 nS and nS, where the color bars correspond to (B) , (C) , (D) , and (E) . The circle, square, and triangle symbols in (B) represent the values of the parameters considered in the computation of the raster plots shown in the right side. The blue and red points in the raster plots indicate the firing of the inhibitory and excitatory neurons over time, respectively. The curly brackets in the upper left corner of the plots denote the autaptic neurons considered.

