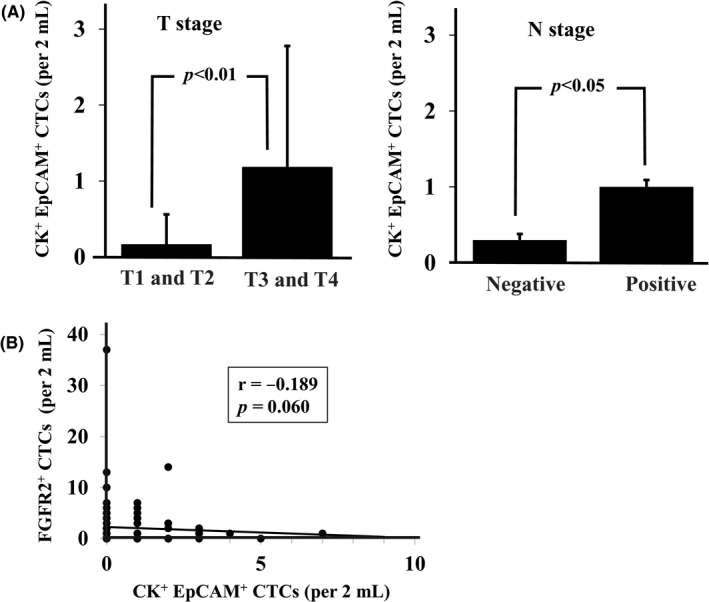
Figure 5.

Correlation between cytokeratin+ (CK+)/EpCAM+ circulating tumor cells (CTCs) and T stage, N stage, or fibroblast growth factor receptor2+ (FGFR2+) CTCs. A, The number of CK+EpCAM+ cells was significantly larger (P = .014) in high T stage and lymph nodes metastasis. B, The number of CK+ EpCAM+ CTCs was not correlated with the number of FGFR2+ CTCs (Spearman's rank correlation test; r = −.189, P = .060)
