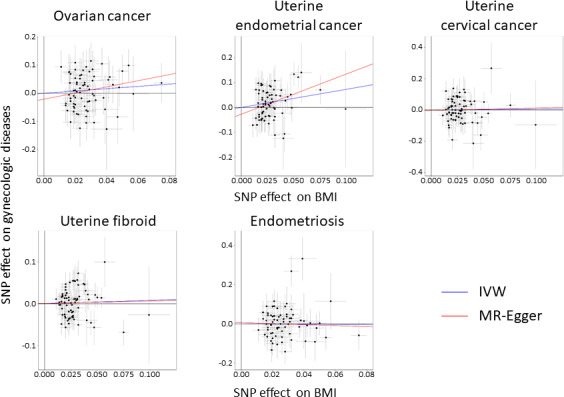
FIGURE 1.

Scatter plots of Mendelian randomization (MR) tests assessing the effect of body mass index (BMI) on each gynecologic disease. Each dot represents effect sizes of each single nucleotide polymorphism (SNP) on BMI (x‐axis) and gynecologic diseases (y‐axis), and regression slopes show the estimated causal effect of BMI on gynecologic diseases. For all plots, inverse variance‐weighted (IVW) results are shown in blue and MR‐Egger regression results are shown in red
