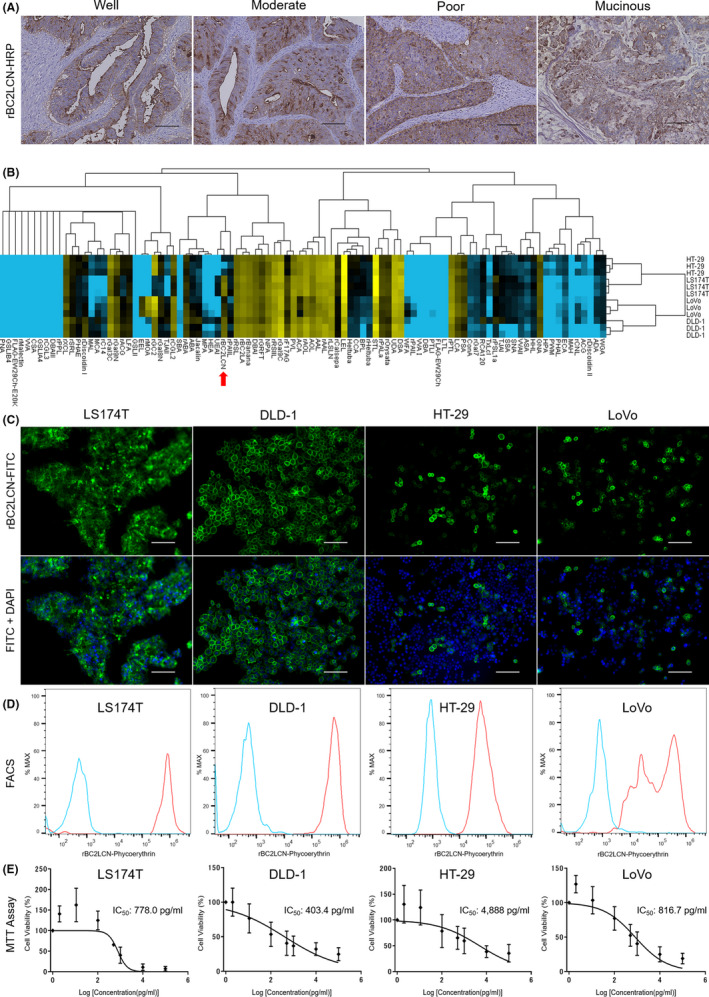
FIGURE 1.

Evaluation of the affinity between rBC2LCN and colorectal cancer cell lines in vitro. A, rBC2LCN lectin staining for clinical colorectal cancers showing representative findings of cancers with diverse levels of cell differentiation (scale bar: 100 µm). B, Quantification of lectin ligands present in cell lysates binding to 96 lectins arrayed on a high‐density microarray (yellow: high; black: intermediate; blue: low). The red arrow notes the position of rBC2LCN. C, Microscopy images of live‐cell staining with FITC‐labeled rBC2LCN (1 µg/mL; scale bar: 100 µm). D, Flow cytometric analysis of rBC2LCN‐PE (1 µg/mL) binding to live cells. E, Cytocidal effect of rBC2LCN‐PE38 on each cell line was evaluated using Cell Counting Kit WST‐8 Assay. PE, phycoerythrin
