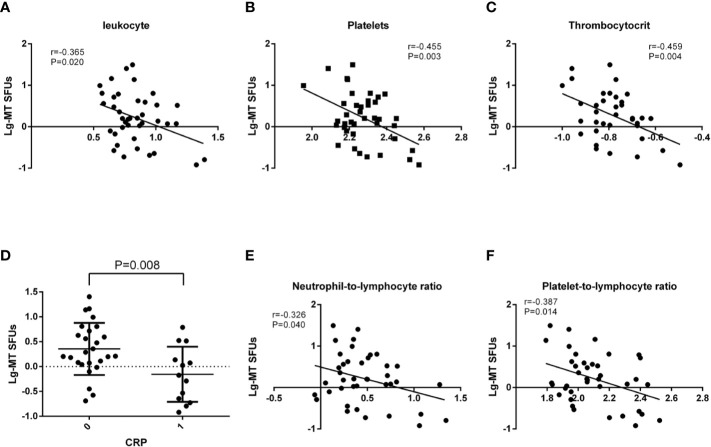
Figure 3.
Correlations between MT peptides-specific SFUs and clinical manifestations. (A–C) Correlations between the average MT-specific SFUs (MT-SFUs) and the leukocytes (A), platelets (B) and thrombocytocrit (C). (D) Comparison of the average MT-SFUs between CRP < 8 mg/mL (indicated as “0”) and CRP ≥ 8 mg/mL (indicated as “1”). (E) Correlation between the average MT-SFUs and neutrophil-to-lymphocyte ratio. (F) Correlation between the average MT-SFUs and platelet-to-lymphocyte ratio. Pearson correlation analysis was used for correlation analysis except for CRP by Student t test.

