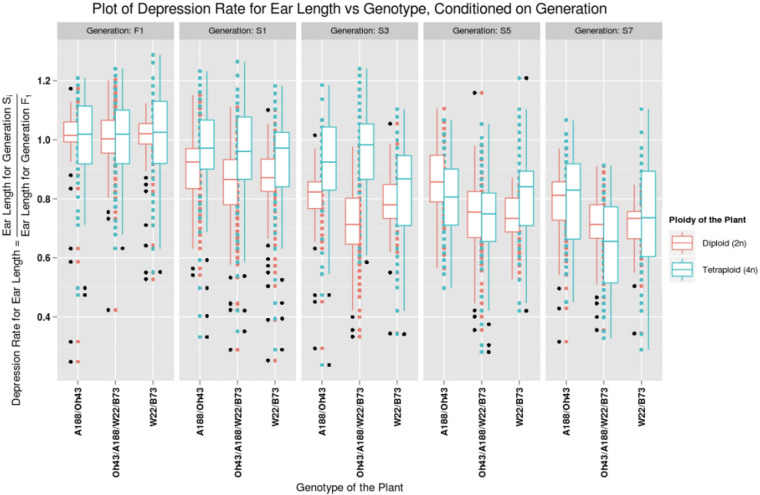
FIGURE 2.
Plot of depression rate for ear length vs. the genotype of the plant, conditioned on generations F1, S1, S3, S5, and S7. The data for diploid plants are graphed in red and the tetraploid plants are graphed in blue. The patterns for a particular ploidy can be observed by looking at the box plots of the corresponding color. The generation varies from F1 to S7 column-wise.

