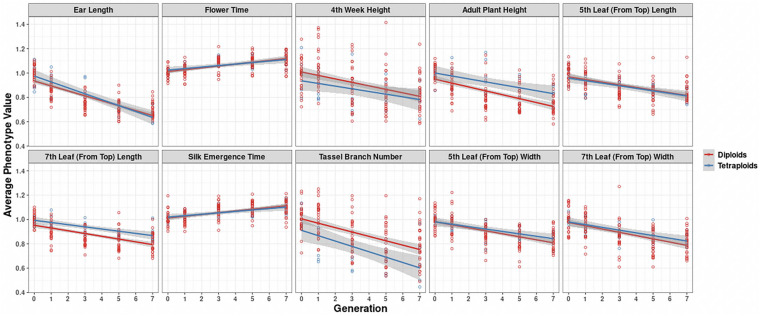
FIGURE 5.
Visualization of inbreeding depression for the 10 phenotypes in the 2008 data conditioned on ploidy. Generation (x-axis) vs. averaged phenotypic values across biological replicates (y-axis) for the 10 traits (panels). Two linear regression lines are superimposed on every panel, and their color indicates the diploid (red) and tetraploid plants (blue). The gray-colored band on a regression indicates the 95% confidence band for the whole line.

