Figure 1.
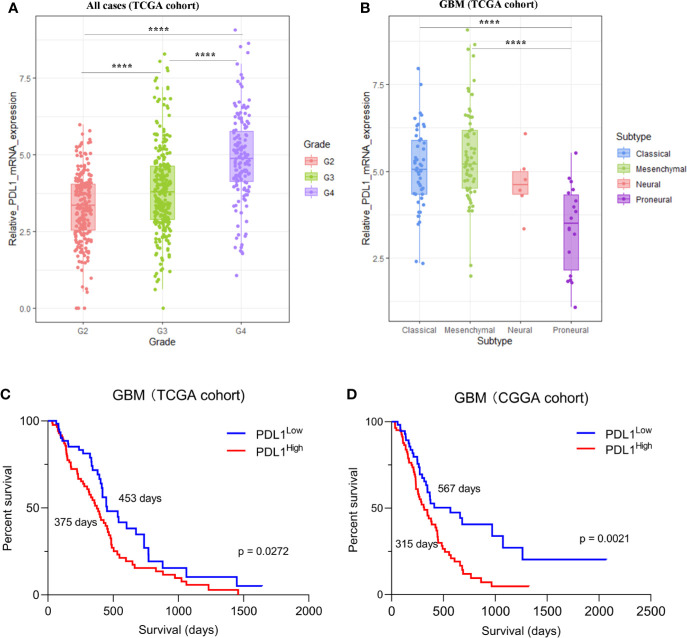
The expression of PD-L1 in gliomas in TCGA dataset. (A). The expression of PD-L1 in each grade of glioma, G2 (Grade II) mean = 3.321, G3 (Grade III) mean = 3.870, G4 (Grade IV) mean = 4.915. (B). Expression of PD-L1 in GBM subtypes, proneural mean = 3.365, neural mean = 4.669, classical mean = 5.078, mesenchymal mean = 5.442; one-way ANOVA followed by Tukey’s multiple comparisons test was used. (C, D). Kaplan-Meier analysis showed the prognosis value of PD-L1 in GBM, median survival days of PD-L1high vs. PD-L1low: 375 days vs 453 days (C, TCGA cohort) and 315 days vs 567 days (D, CGGA cohort); Log-rank test was used; ****p < 0.0001.

