
Figure 4.
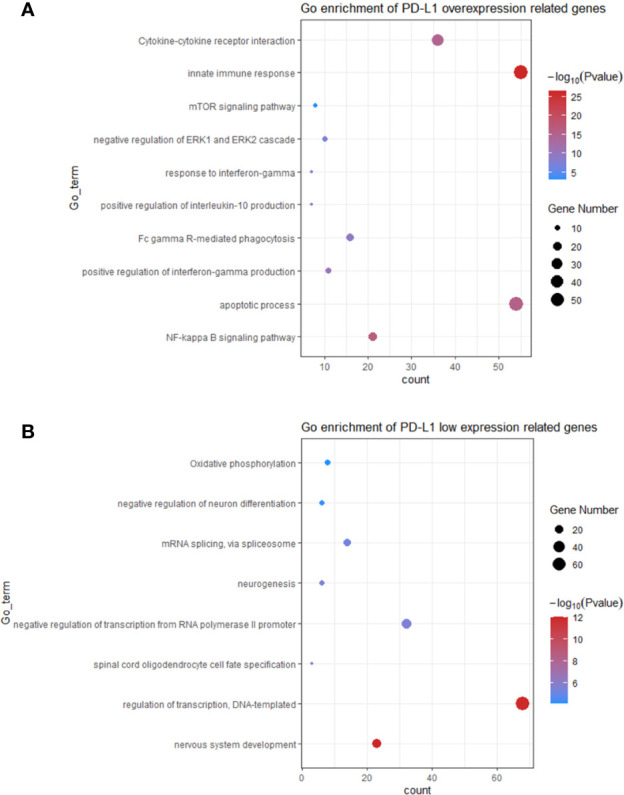
The top bioinformatics hits of biological pathways derived from genes enriched in GBM patients with PD-L1high (A) and PD-L1low (B). Plot sizes show gene counts enriched in the enrichment of pathway. Colour depth indicates the p value from low (red) to high level (blue). The p values of all presented hits are less than 0.05.