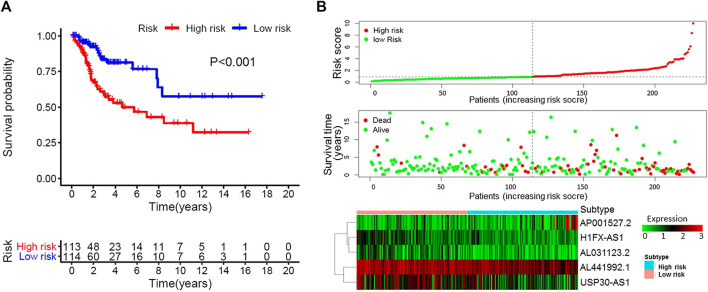
FIGURE 2.
Characteristics of the patients in the combination set based on the constructed model. (A), Kaplan–Meier curve of the high-risk and low-risk groups of combination set showed differences in survival rate. (B), Distribution of risk score, survival status of each patients, and heat map expression of five immune-related Long non-coding RNAs in high-risk and low-risk groups were presented.

