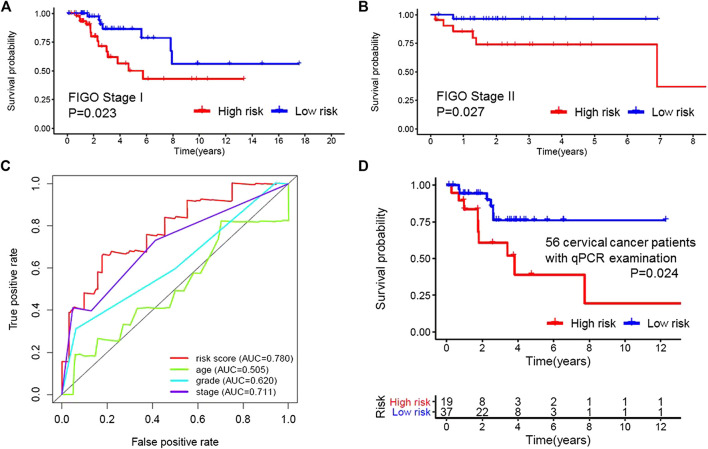
FIGURE 3.
Applicability and reliability of the prognostic model. (A,B) Kaplan–Meier curve of FIGO stages I and II of the high- and low-risk groups. (C), Receiver operating characteristic (ROC) curve of the risk score, age, grade, and stage. The area under the ROC curve (AUC) of the prediction model was 0.780, which was much better than that of age (0.505), grade (0.620) and FIGO stage (0.711). (D) Kaplan–Meier curve of 56 cervical cancer patients. 56 patients from our cancer center were selected and QRT-PCR was used to calculate the expression level of five Long non-coding RNAs, finally the prognostic model was validated using their accordingly clinical data.

