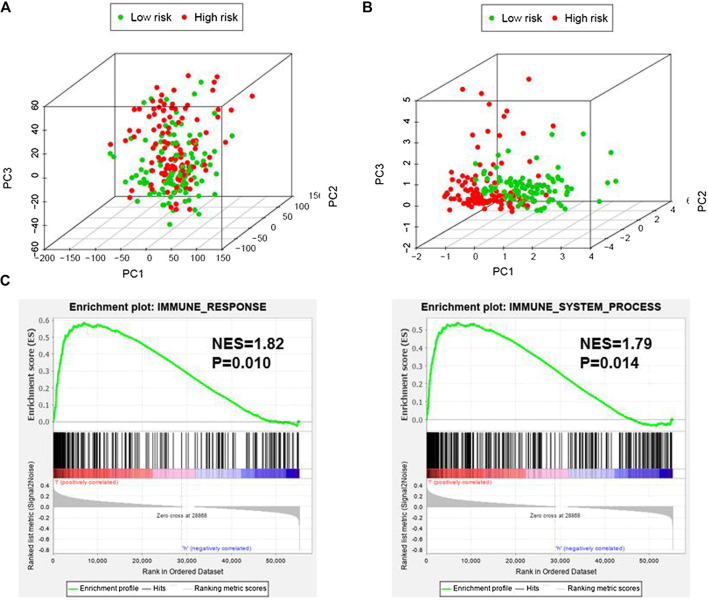
FIGURE 4.
Immune status of the high- and low-risk groups. (A), Principal component analysis (PCA) showed that whole gene expression profiles between the high- and low-risk groups were mixed up. (B), PCA indicated that the distribution of immune-related genes between the high- and low-risk groups were significantly different. (C), Gene set enrichment analysis implied that the low-risk group had adequate immune response and immune system process pathways. NES, Normalized Enrichment Score.

