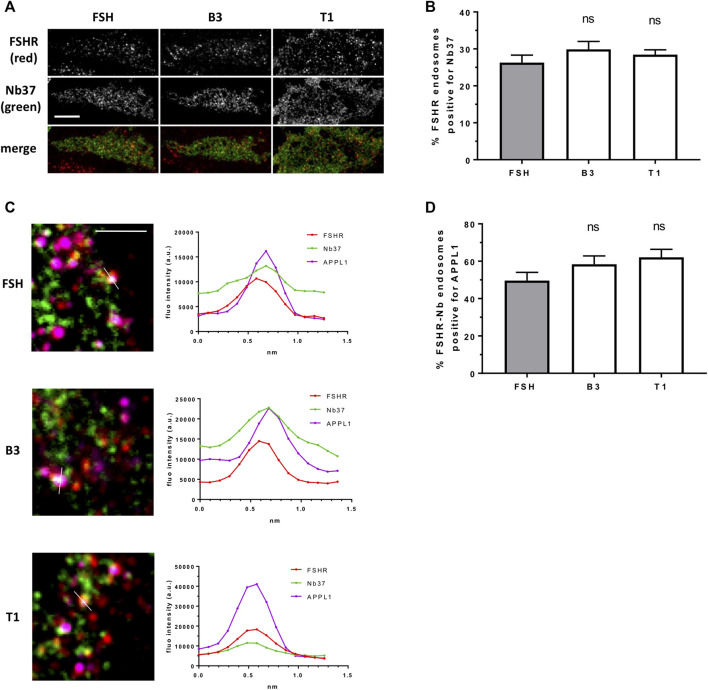
FIGURE 5.
LMW compounds induce Gαs activation from FSHR endosomes. (A) TIR-FM images of FLAG-FSHR (red) expressing cells transfected with Nb37-GFP (green) treated with either FSH (10 nM), B3 or T1 (10 μM) for 5 min. Scale bar = 10 μm. (B) Quantification of FSHR endosomes from (A); n = 24 cells/condition in three independent experiments. (C) TIR-FM images (top) of FLAG-FSHR (red), Nb37-GFP (green) and endogenous APPL1 (magenta) in cells stimulated with either FSH, B3 or T1 for 5 min. Scale bar = 3 μm. Line scan analysis of fluorescence intensity (bottom) is shown for one endosome per condition showing FSHR-Nb37-APPL1 colocalization (representative of 233, 302, 316 endosomes for FSH, B1, T3, respectively). (D) Quantification of FSHR-Nb37 endosomes positive for APPL1 after 5-min stimulation with either FSH, B3 or T1; n = 11–12 cells/condition from (C) from three independent experiments.

