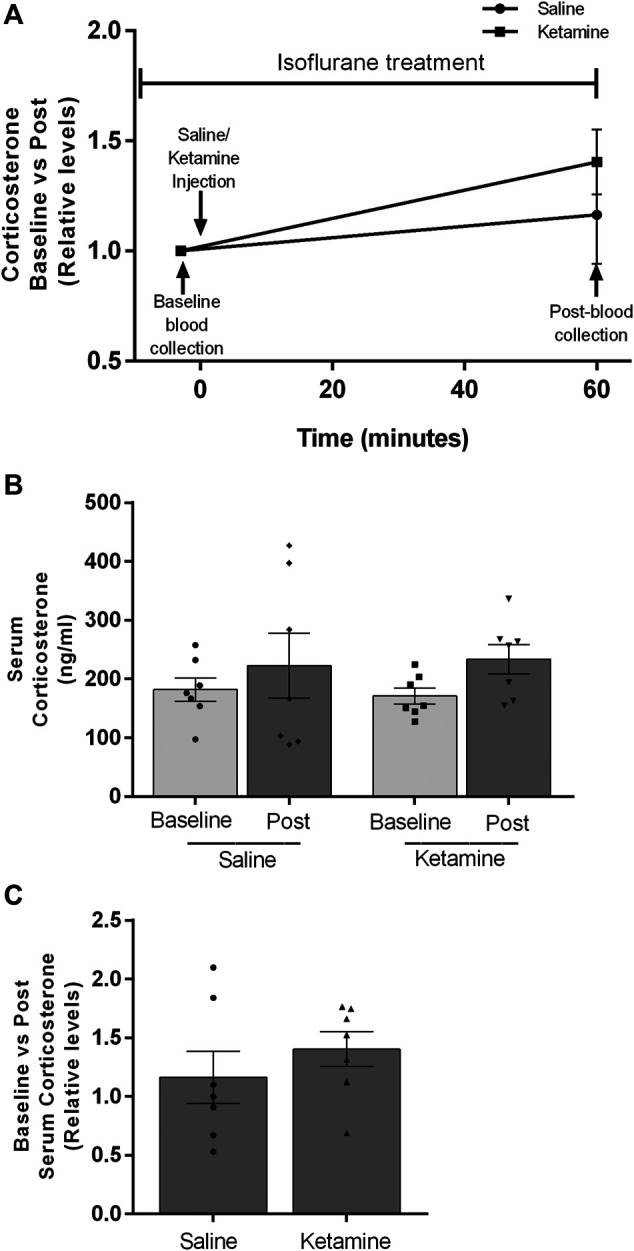
FIGURE 3.

Circulating corticosterone levels of male rats under isoflurane anesthesia before and after saline or ketamine injection. (A) Timeline showing the experimental design. Blood collection and injection timepoints are noted with black arrows. (B) Post-injection corticosterone levels for saline and ketamine (n = 7 for both groups). (C) Fold increases between pre and post corticosterone levels after injection.
