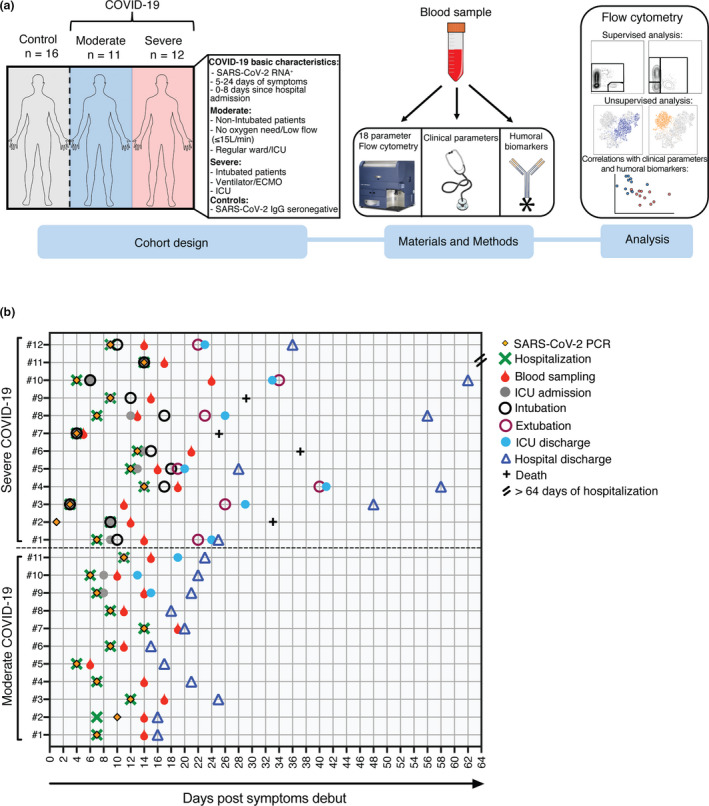
Figure 1.

Experimental design and COVID‐19 cohort characteristics. (a) Schematic representation of the cohort characteristics (left), materials and methods (middle) and the type of analysis performed using the flow cytometric data (right). (b) Graphical overview of all COVID‐19 patients (n = 23) illustrating clinical events from the day of symptom debut. Depicted are the day of the SARS‐CoV‐2 PCR test, hospitalisation and blood sampling. For all the severe patients and three of the moderate patients, the day of the intensive care unit (ICU) admission and discharge is indicated. Furthermore, the day of intubation/extubation of the severe patients is shown. Lastly, depicted is the day of hospital discharge for 22 out of 23 patients and the number of deceased patients (n = 4). One patient from the severe group (#11) is still in ECMO with ongoing hospitalisation (> 64 days).
