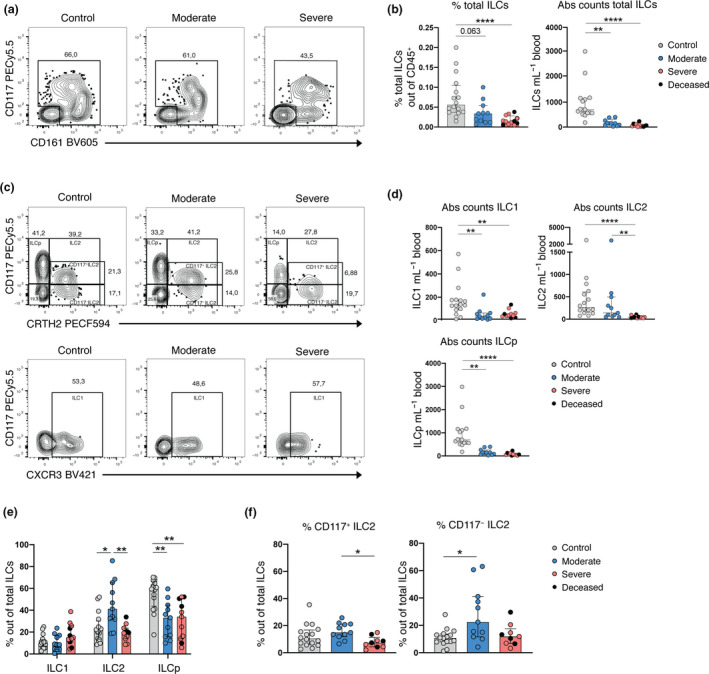
Figure 2.

Depletion and altered frequency of ILCs in the peripheral blood of COVID‐19 patients. (a) Representative flow cytometry plots depicting the gate for the identification of the total ILCs in one control donor, one moderate and one severe COVID‐19 patient. (b) Bar plot summaries of the percentage (left) and absolute counts (per mL of blood) (right) of total ILCs in control donors (n = 16), moderate (n = 11) and severe (n = 12) COVID‐19 patients. (c) Representative flow cytometry plots depicting total ILCs gated as: ILCp, ILC2 (CD117+/−) (upper row) and ILC1 (lower row) in one control donor, one moderate and one severe COVID‐19 patient. (d) Bar plot summaries of absolute counts of ILC1, ILC2 and ILCp subsets (per mL of blood) in control donors (n = 16), moderate (n = 11) and severe (n = 11) COVID‐19 patients. (e) Bar plot summaries of the percentage of ILC1, ILC2 and ILCp of total ILCs in control donors (n = 16), moderate (n = 11) and severe (n = 11) COVID‐19 patients. (f) Bar plot summaries of the percentage of CD117+ and CD117− ILC2 of total ILCs in control donors (n = 16), moderate (n = 11) and severe (n = 9) COVID‐19 patients. (b, d, e, f) Statistical differences were tested using the Kruskal–Wallis test followed by Dunn's multiple comparisons test. Numbers in flow cytometry plots indicate percentage of cells within the mother gate. Bar graphs are shown as median ± IQR, *P < 0.05, **P < 0.01, ***P < 0.001. Patients with low cell numbers (fewer than 20 events) in the corresponding gate were removed from the analysis.
