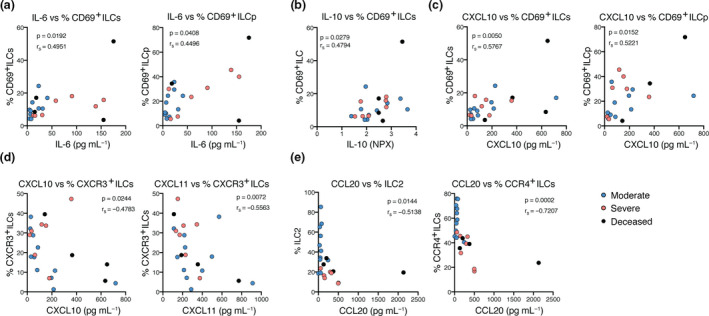
Figure 5.

Activation status and homing profile of peripheral blood ILCs associate with inflammation markers in COVID‐19 patients. Spearman correlations between (a) serum IL‐6 levels (pg mL−1) and the percentage of CD69+ ILCs and CD69+ ILCp; (b) serum IL‐10 relative levels (NPX) and the percentage of CD69+ ILCs; (c) serum CXCL10 levels (pg mL−1) and the percentage of CD69+ ILCs and CD69+ ILCp; (d) serum CXCL10 and CXCL11 levels (pg mL−1) and the percentage of CXCR3+ ILCs; (e) serum CCL20 levels (pg mL−1) and the percentage of ILC2 and CCR4+ ILCs in COVID‐19 patients. IL‐6, CXCL10, CXCL11 and CCL20 serum absolute levels were measured with Magnetic Luminex Screening assay, and IL‐10 relative levels with a proximity extension assay, where data are shown as normalised protein expression (NPX). Blue circles: moderate COVID‐19 patients (n = 11); pink circles: severe COVID‐19 patients (n = 11); black circles: deceased severe COVID‐19 patients (n = 4). P < 0.05 was considered statistically significant. r s: Spearman's rank correlation coefficient.
