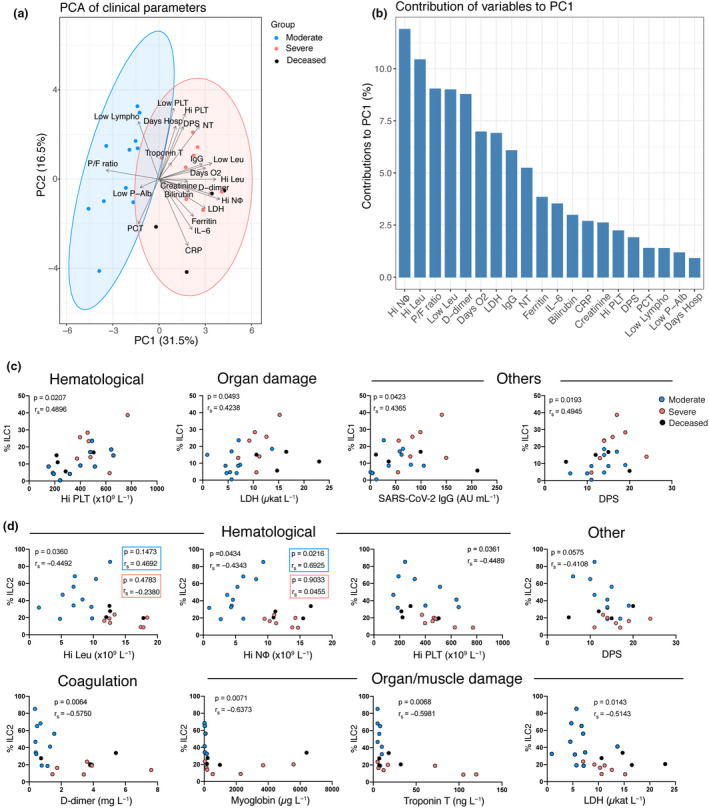
Figure 6.

Peripheral blood ILC subsets associate with biochemical and haematological parameters that reflect COVID‐19 severity. (a) Principal component analysis (PCA) of COVID‐19 patients displaying the distribution and segregation of COVID‐19 patients according to clinical and laboratory parameters. (b) Bar plot showing the percentage contribution of each clinical or laboratory parameter to principal component 1 (PC1). (c) Correlation plots between the percentage of ILC1 and the indicated haematological (Hi PLT), organ damage (LDH) and other parameters (SARS‐CoV‐2 IgG and DPS) in COVID‐19 patients (moderate n = 11; severe n = 11). (d) Correlation plots between the percentage of ILC2 and the indicated haematological (Hi Leu, Hi NΦ, Hi PLT and DPS), coagulation (D‐dimer), organ damage (myoglobin, troponin T and LDH) and other (DPS) parameters in COVID‐19 patients (moderate n = 11; severe n = 11). Hi NΦ: highest neutrophil count ± 24 h from sampling (f.s.); Hi Leu: highest leukocyte count ± 24 h f. s.; P/F ratio: PaO2/FiO2 ratio (mmHg) at sampling; Low Leu: Lowest leukocyte count ± 24 h f. s.; D‐dimer: highest D‐dimer level ± 24 h f. s.; Days O2: days of oxygen treatment; LDH: highest lactate dehydrogenase before sampling (b.s); IgG/SARS‐CoV‐2 IgG: SARS‐CoV‐2 IgG antibody level; NT: neutralising antibody titres at sampling; Ferritin: highest ferritin level ± 24 h f. s.; IL‐6: IL‐6 levels at the time of sampling; Bilirubin: highest bilirubin ± 24 h f. s.; CRP: highest C‐reactive protein ± 24 h f. s.; Creatinine: highest creatinine ± 24 h f. s.; Hi PLT: highest platelet count b.s; DPS: days post‐symptom debut until sampling; PCT: highest procalcitonin ± 24 h f. s.; Low Lympho: Lowest lymphocyte count ± 24 h f. s.; Low P‐Alb: lowest P‐Albumin ± 24 h f. s.; Days Hosp: days of hospitalisation until sampling. Spearman’s rank correlation test was applied for assessing correlations between variables.
