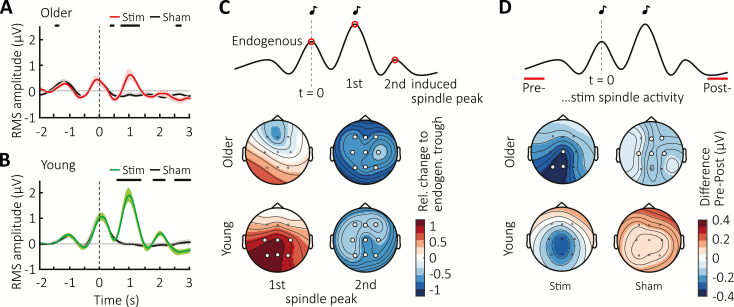
Figure 3.
Immediate effects on fast spindle activity. Mean ± SEM RMS-signal in the 12–15 Hz spindle-band from Cz averaged time-locked to the first click for Sham (black) and Stimulation conditions in (A) the older population (red) and (B) the young adult group (green). Vertical lines indicate timing of the first click, whereas thick horizontal black bars mark time points of significant difference between conditions. (C) Top schematic illustrates the time points during which fast spindle peak activity was obtained to determine the relative change of the evoked response with respect to the endogenous SO shown below color-coded in topographical maps. (D) Topographic distribution of the color-coded difference in RMS-spindle activity between two 500-ms intervals preceding (Pre) and following (Post) acute two-click stimulation or Sham-trials for the older and younger population, as illustrated in the schematic above. Vertical grey lines mark time point of the first click (t = 0). White circles indicate channel location with a significant relative change (C) or difference (D) from baseline after FDR correction.

