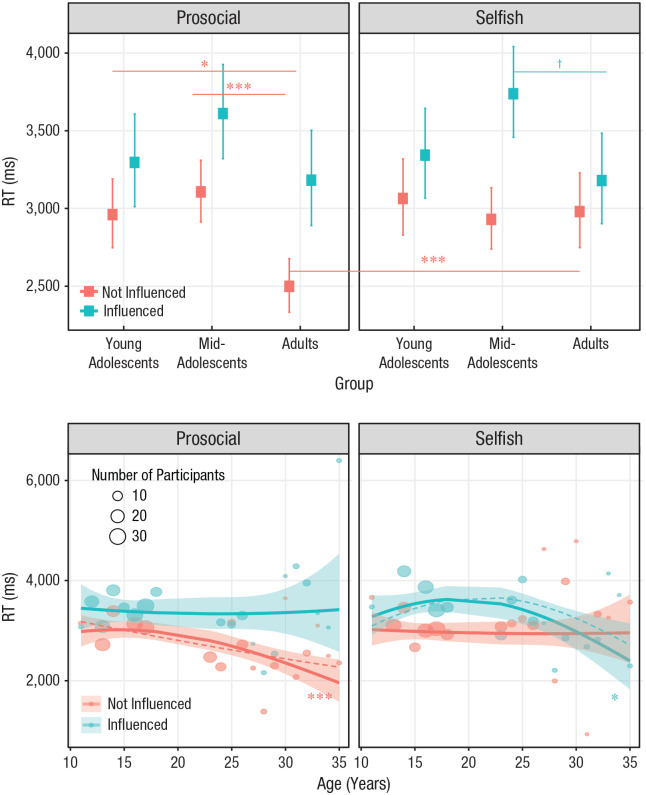
Fig. 6.
Interaction of age group, direction of influence (prosocial vs. selfish), and influence (influenced vs. not influenced) on response times (RTs). In the top graph, age is shown as a categorical variable. Colored squares show the fixed-effects estimates of RTs from the trial-level linear mixed model. Error bars are the corresponding 95% confidence intervals. Symbols indicate significant and marginally significant differences between and within groups (†p < .10, *p < .05, ***p < .001, Bonferroni corrected). For statistics of all contrasts, see Tables S5a and S5b in the Supplemental Material available online. In the bottom graph, age is shown as a continuous variable. Circles are grand medians of RTs. Circle area is proportional to the number of participants; the key shows three examples for reference. The lines show the overall polynomial trends of age as estimated by a trial-level generalized linear mixed model on the log of RTs (then back-transformed to the response scale). The shaded area is the 95% confidence interval. Asterisks indicate significant components of the trends (dashed lines; *p < .05, ***p < .001). For statistics of all trend contrasts, see Table S6 in the Supplemental Material.

