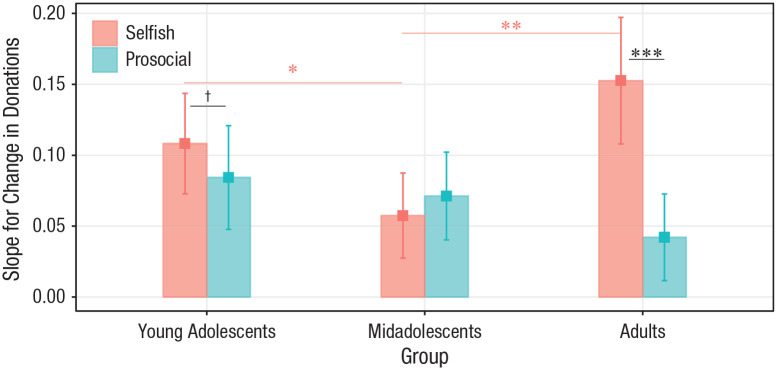
Fig. 7.
Interaction of age group, distance from norm, and direction of influence (prosocial vs. selfish) on influence magnitude. Slopes quantify the association between the distance from the norm and the subsequent magnitude of conforming donation change. Bars show fixed-effects estimates of slopes from the trial-level linear mixed model. Error bars are the corresponding 95% confidence intervals. Symbols indicate significant and marginally significant differences between groups (pink) and within groups (black; †p < .10, *p < .05, **p < .01, ***p < .001, Bonferroni corrected). For statistics of all contrasts, see Table S8 in the Supplemental Material available online.

